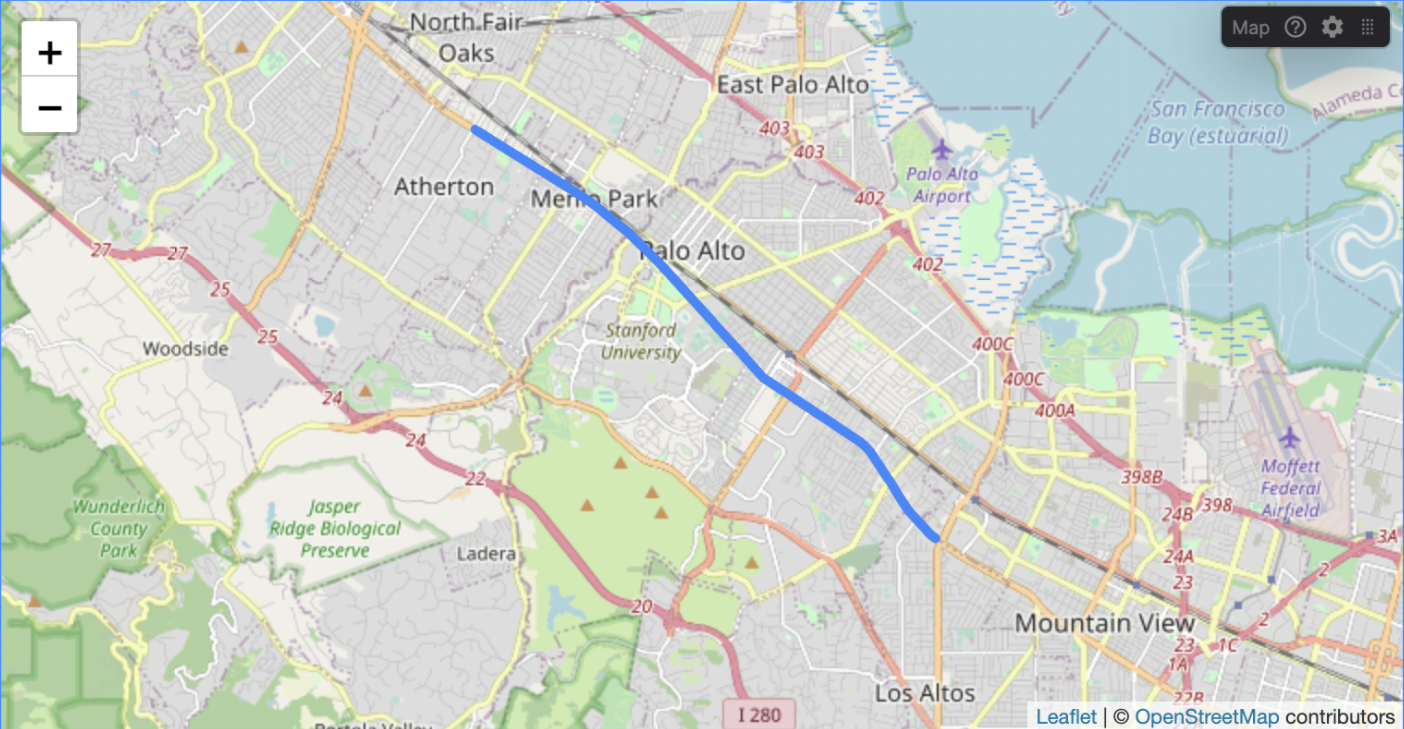
Map panel
Display GPS and GeoJSON data on a world map.
Supported messages
To use this panel, your data must provide messages conforming to one of the following supported schemas.
LocationFix
For GPS points with support for displaying the signal accuracy if available.
| framework | schema |
|---|---|
| ROS 1 | sensor_msgs/NavSatFix |
| ROS 2 | sensor_msgs/msg/NavSatFix |
| Custom | foxglove.LocationFix |
GeoJSON
For displaying arbitrary shapes or points.
| framework | schema |
|---|---|
| Custom | foxglove.GeoJSON |
Use the name and style fields within the properties field of each GeoJSON feature to label and style objects on the map. For example, the message below will be labeled "Named Polygon" and have the specified styling:
{
  type: "FeatureCollection",
  features: [{
      type: "Feature",
      properties: {
        name: "Named Polygon",
        style: {
          color: "#ff0000",
          dashArray: "4 4",
          lineCap: "butt",
          opacity: "1",
          weight: 4,
        },
      },
      geometry: ...
  }]
}
See the leaflet documentation for additional supported style attributes.
Settings
General
| field | description |
|---|---|
| Base layer |
|
| Custom map tile URL | Displayed when the Custom type is selected. URL to your custom map tiles following the Tile Map Service specs, for example https://my.custom.url/{x}/{y}/{z}.png |
| Max tile level | Displayed when the Custom type is selected. Highest zoom supported by the custom map source. See leaflet documentation for more information. |
| Follow topic | Topic to follow in the panel viewport |
| Location fix | The location fix to follow (This selection is only present if there are multiple fixes in the selected follow topic due to foxglove.LocationFixes) |
Layers
Add additional layers on top of the base map to display more information, such as nautical charts, topography, or custom tile layers.
| field | description |
|---|---|
| Type |
|
| Custom map tile URL | Displayed when the Custom type is selected. URL to your custom map tiles following the Tile Map Service specs, for example https://my.custom.url/{x}/{y}/{z}.png. See Leaflet's TileLayer documentation for more information. Most OpenStreetMap based services also work for this. |
| Opacity | Adjust layer visibility from fully transparent (0) to fully opaque (1) |
Use the layer actions to:
- Toggle visibility for each layer
- Reorder layers (move up/down) to control stacking
- Delete layers
Topics
The Topics section allows you to toggle visibility and settings for individual topics.
| field | description |
|---|---|
| Coloring | Color mode for the GPS or GeoJSON features. Automatic: color is automatically assigned Custom: you pick the color |
| Marker | Configure GPS location marker shape. Pin: display as a "pin" marker icon (fixed blue color) Dot: circle Diamond: diamond (rhombus) Square: square Plus: plus sign (+) Cross: X shape |
| Point size | Sets the diameter of points rendered on the map for this topic, in pixels. |
| Time range | Control which messages are displayed. Latest: display only the latest message All previous: display all messages from the start of the file up to the current playback time Last N seconds: display messages within a sliding time window relative to the current playback time All: display all available messages for the topic |
| Seconds | Displayed when Last N seconds is selected. Number of seconds of data to show relative to the current playback time (default: 30). |
Using custom maps
Load custom map layers by pointing to a URL that serves rasterized slippy tiles following the Tile Map Service specification with Web Mercator projection. See Leaflet's TileLayer documentation for more information on URL template construction. Most OpenStreetMap based services will work for this. See Switch2OSM for more information on serving your own tiles.
Controls and shortcuts
- Hover over the playback bar to highlight map points corresponding to that time
- Hover over a point on the map to highlight its corresponding time in the playback bar
- Click a map point to seek playback to that time
- Scroll over the map to zoom; drag the map to pan (zoom and pan levels will be persisted to the layout)
