Python
Connect directly to Foxglove or play back local data recorded with the Python SDK.
Install the SDK
The SDK is distributed through PyPI. You can get started with a new project or use Foxglove from a notebook.
The exact installation will depend on your package manager; here's an example using uv.
uv init example
cd example
uv add foxglove-sdk
Live data
Log messages from Python
Edit the generated main.py:
import foxglove
import time

foxglove.start_server()

while True:
    foxglove.log("/hello", {"time": time.time()})
    time.sleep(0.03)
Run the script
Run the script to start logging. Following the uv example above, you can run the following command from the "example" directory:
uv run python main.py
Connect
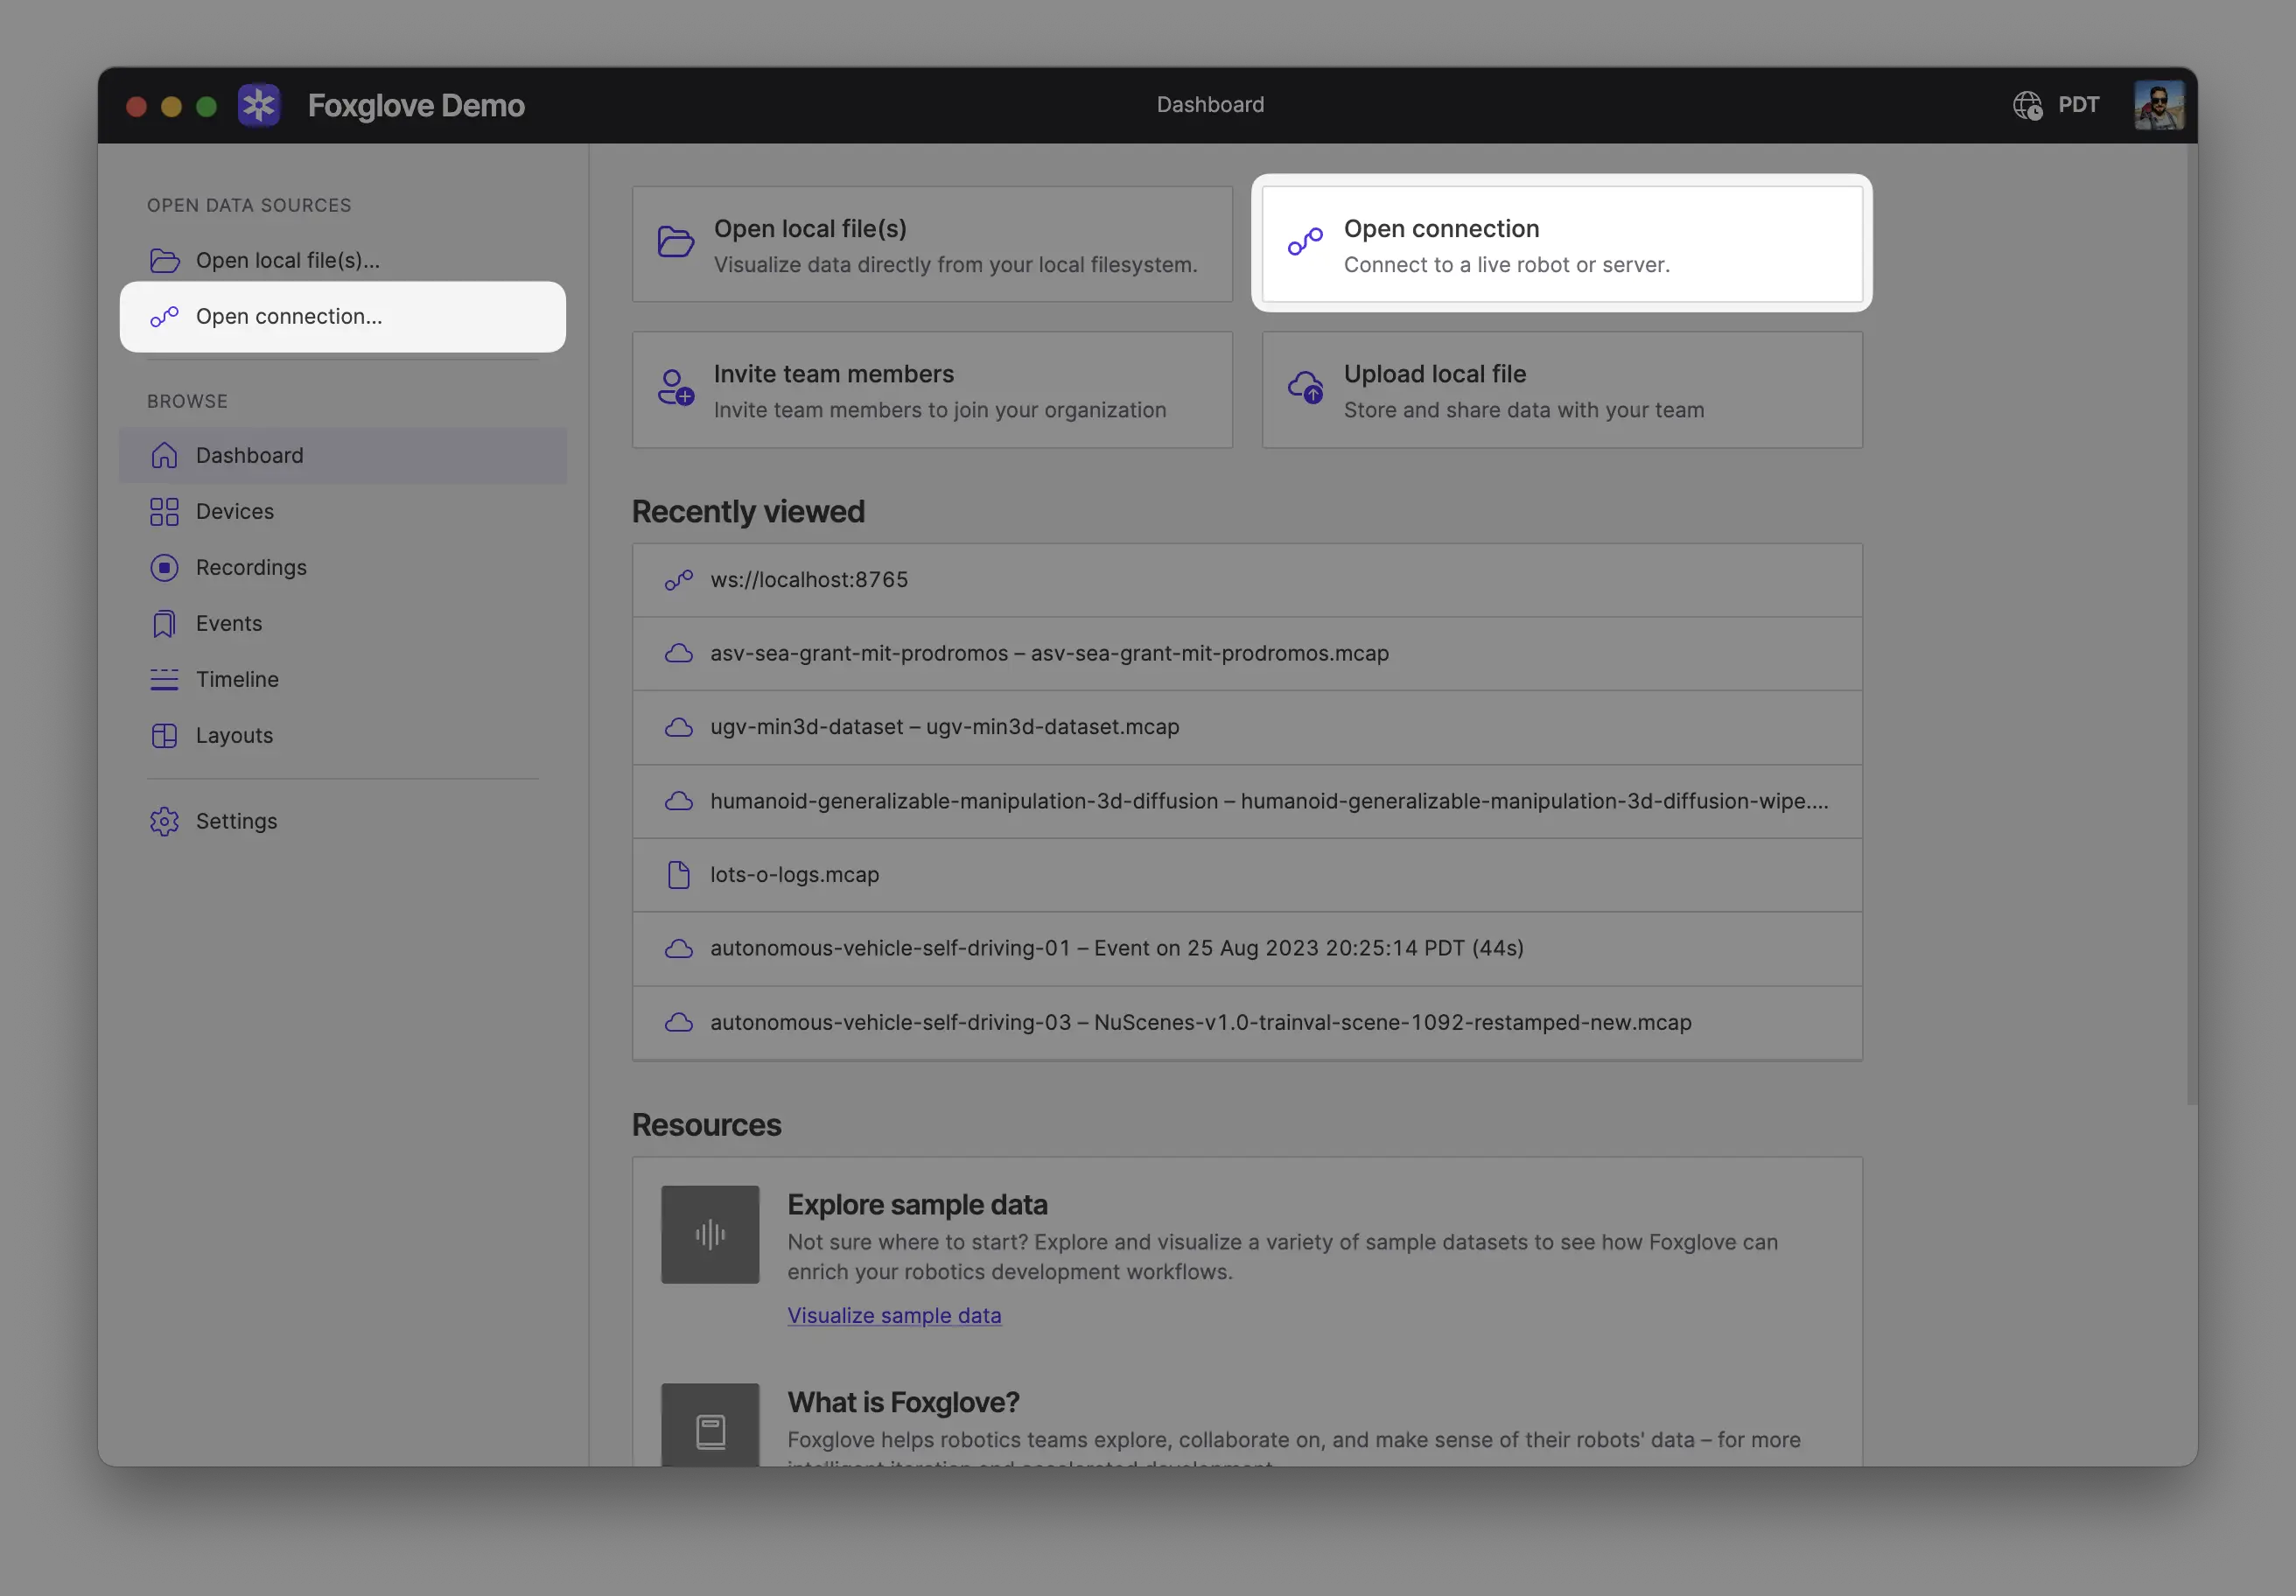
In Foxglove, select "Open connection" from the dashboard or left-hand menu.
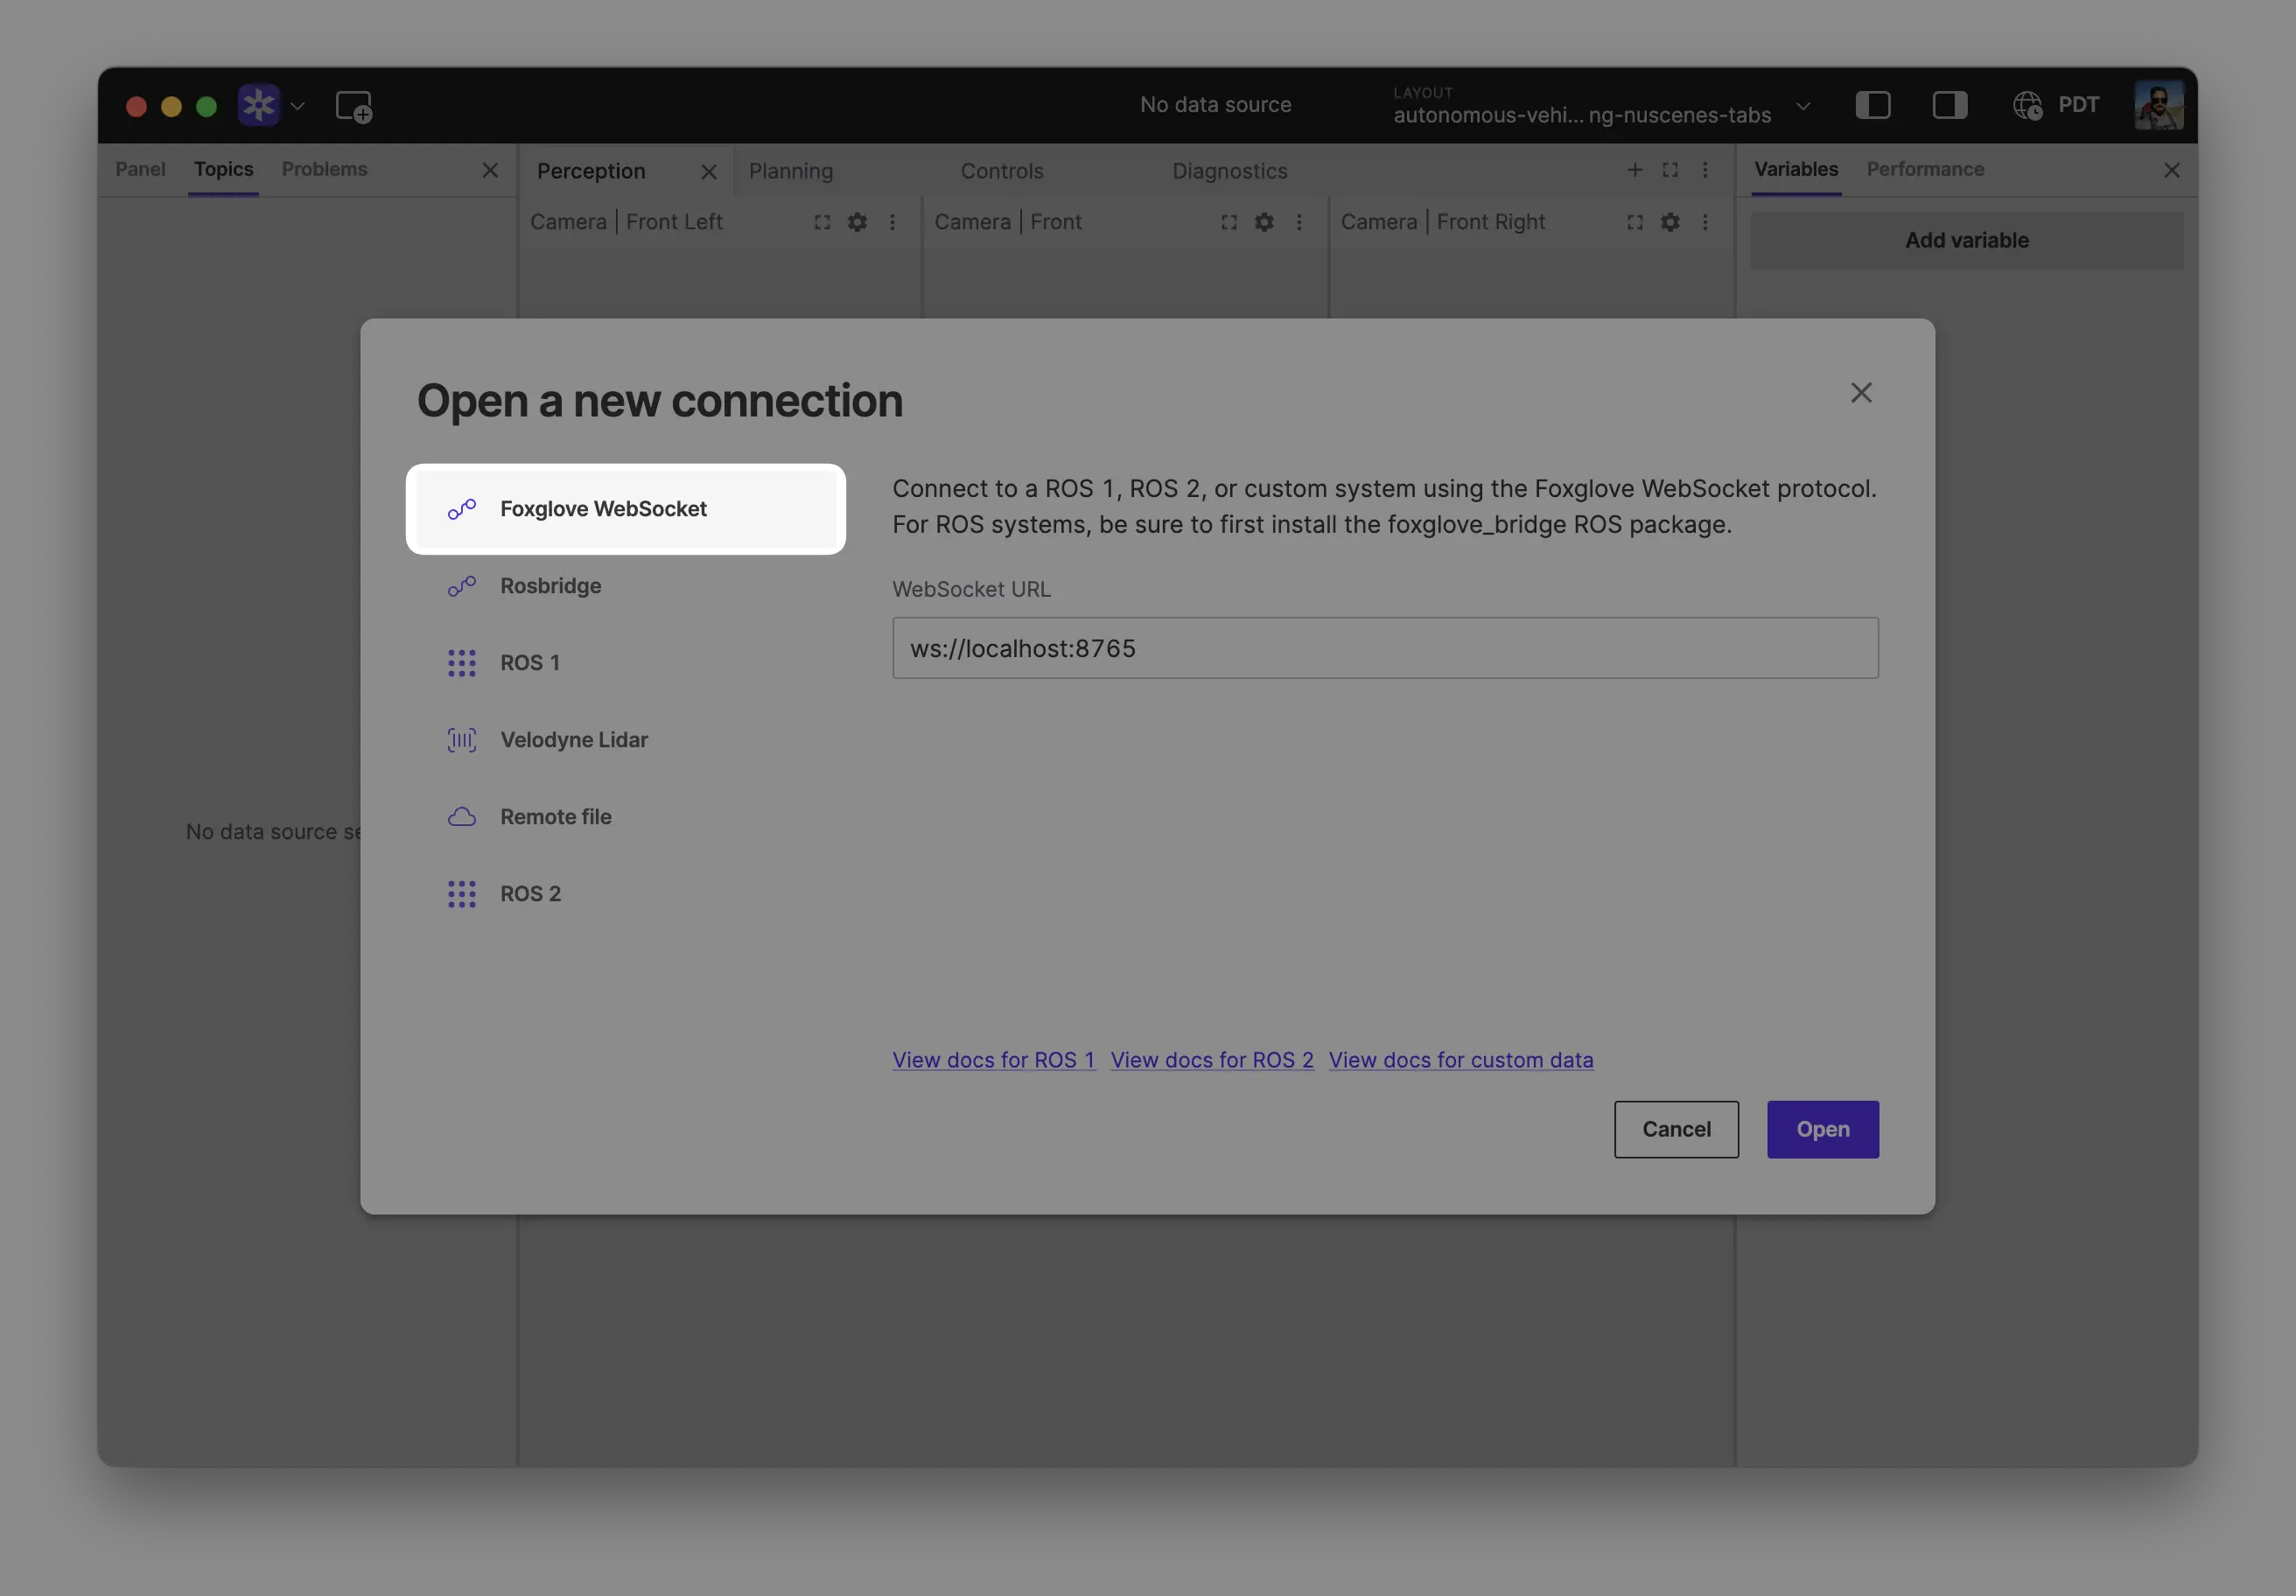
Select "Foxglove WebSocket" in the "Open a new connection" dialog, then click "Open" to accept the default connection string:
Local data
Recording data to a file
The SDK can also log data to disk. Let's augment the example above to also produce an MCAP file which can later be opened in Foxglove:
import foxglove
import time

foxglove.start_server()

# Keep a reference to the mcap. It will automatically close the file when the program exits, but
# we could also close it manually with `mcap.close()`.
with foxglove.open_mcap("example.mcap"):

    while True:
        foxglove.log("/hello", {"time": time.time()})
        time.sleep(0.03)
Viewing data from a file
Open your recording(s) directly from your computer by:
- Dragging and dropping them into Foxglove
- Using
Cmd/Ctrl + o - Clicking Open local file(s) in the app
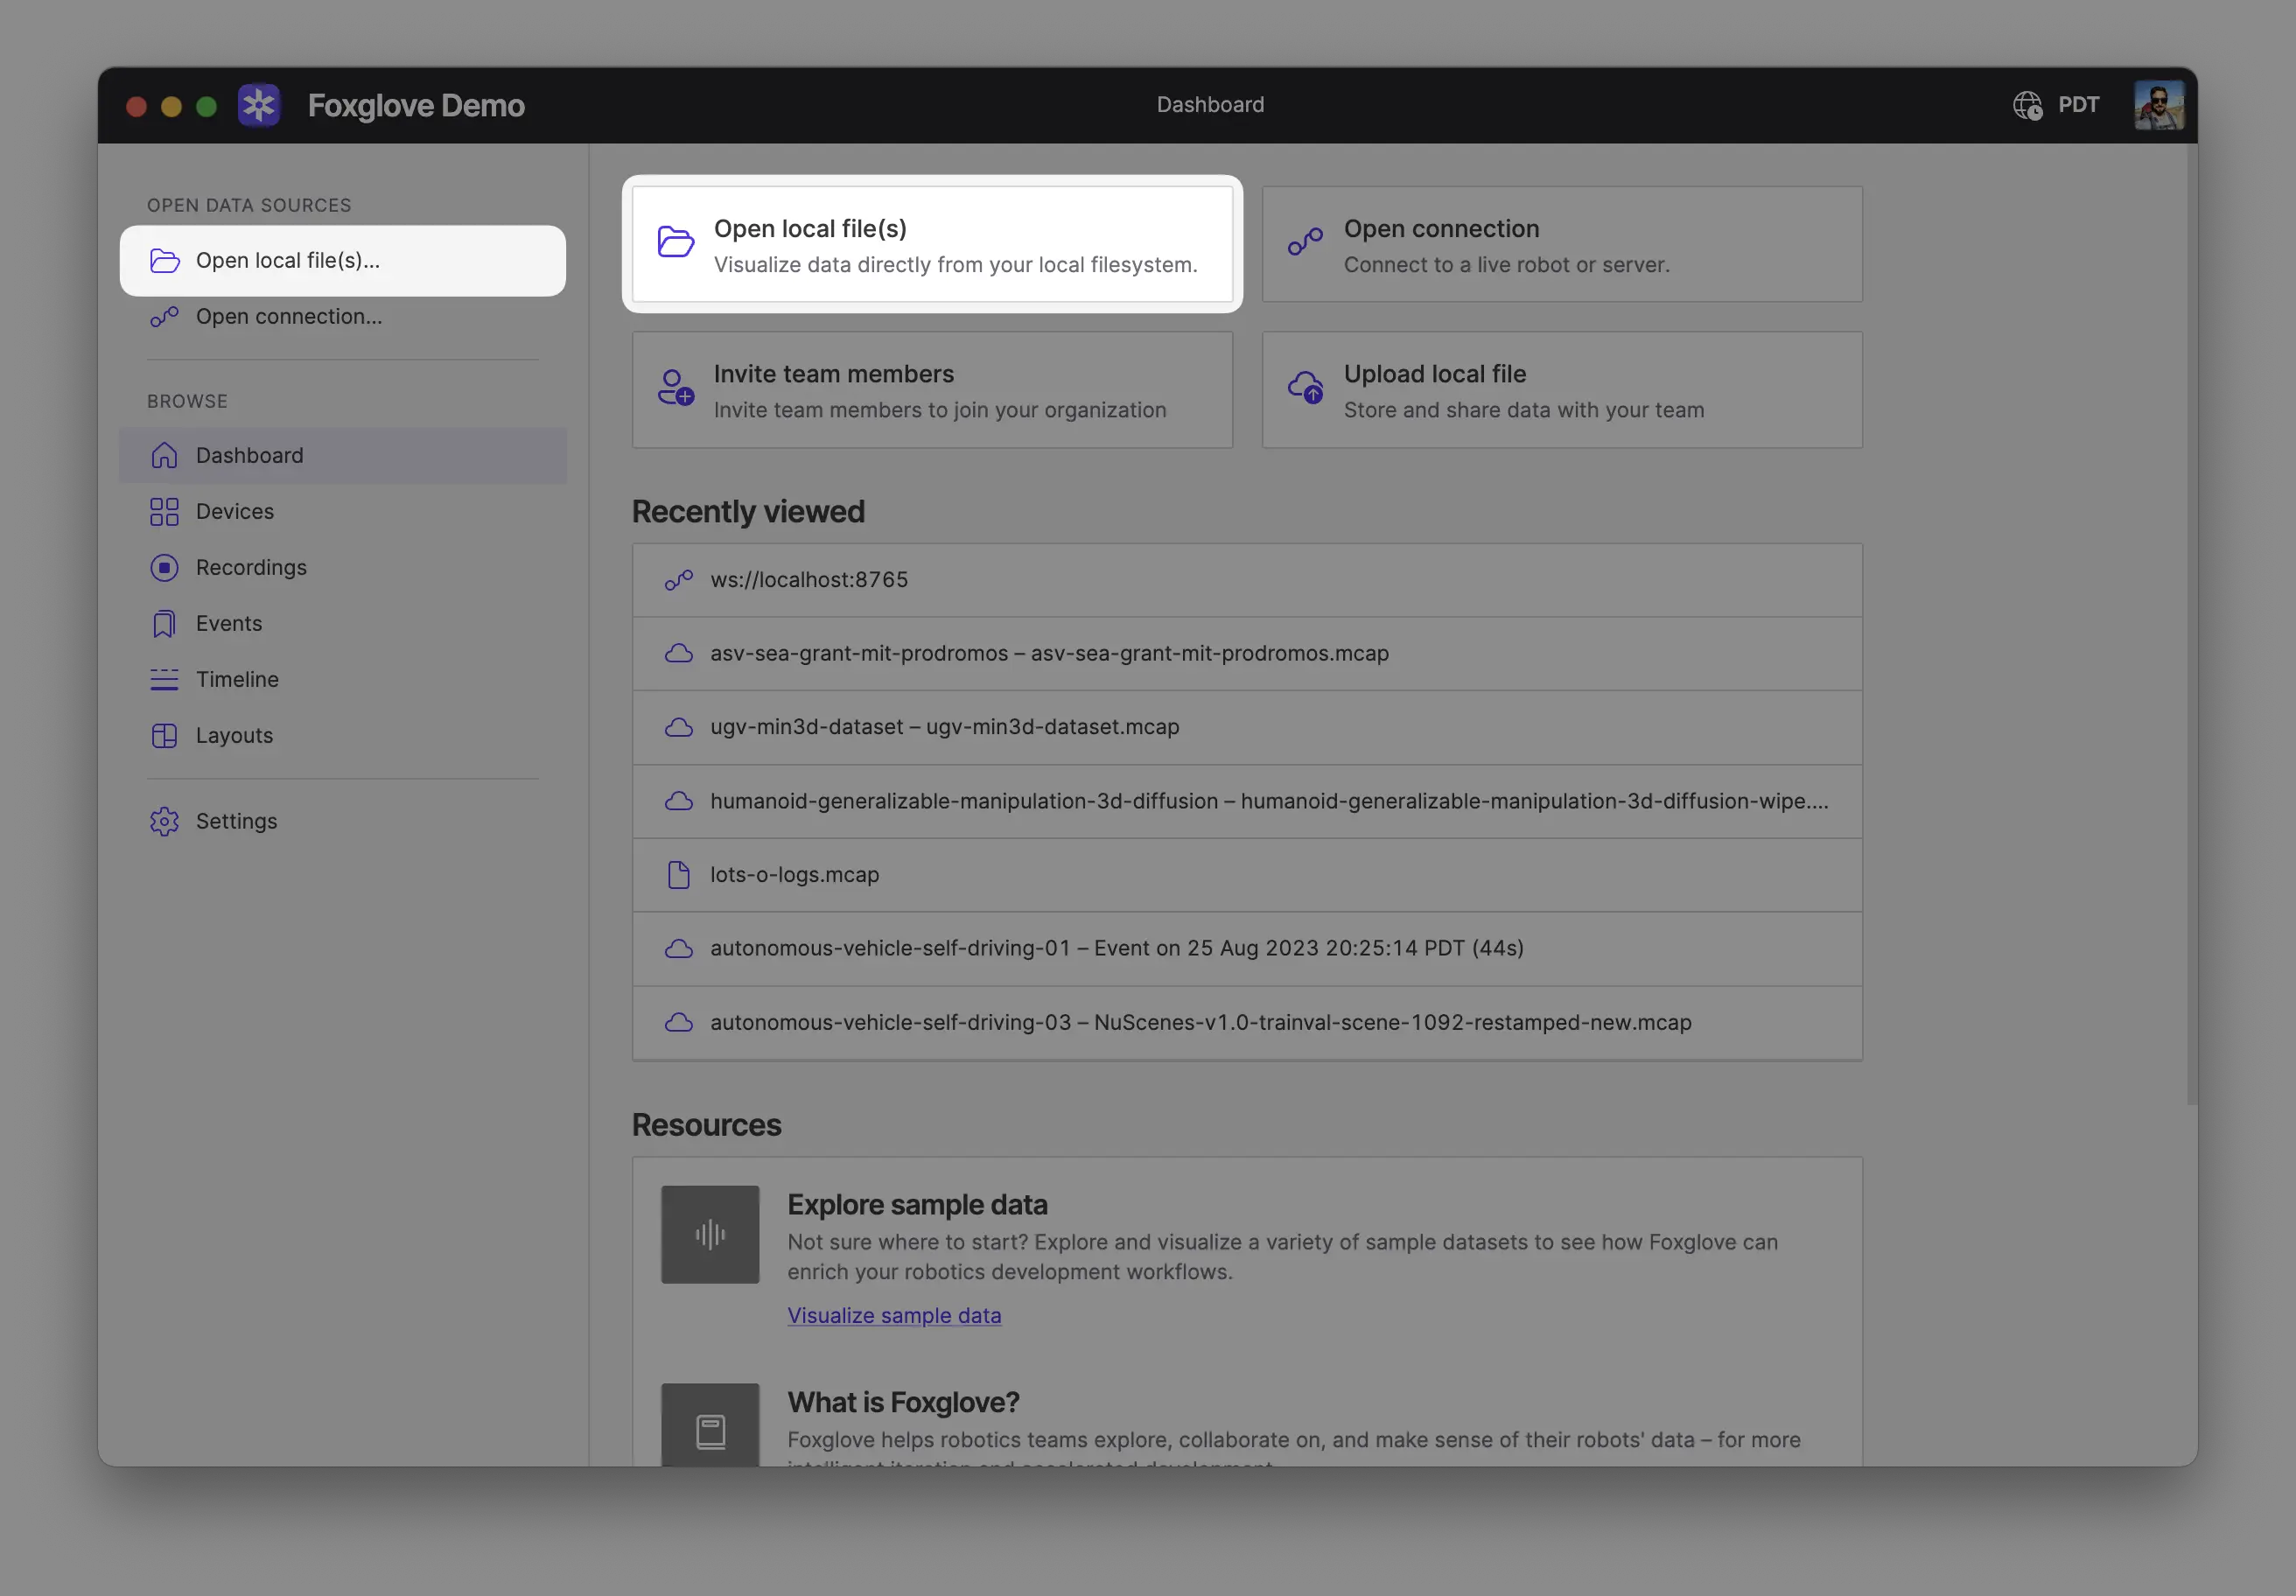
Opening multiple files together combines them into a single merged data source, as if they came from one recording. This is useful when the files belong to the same recording, for example a single recording split into multiple segments, or a main recording plus a related file such as a separate transforms log. The files must be of the same format.
To keep sources separate and view their data together on a shared timeline, use Comparison mode instead.
Explore your data
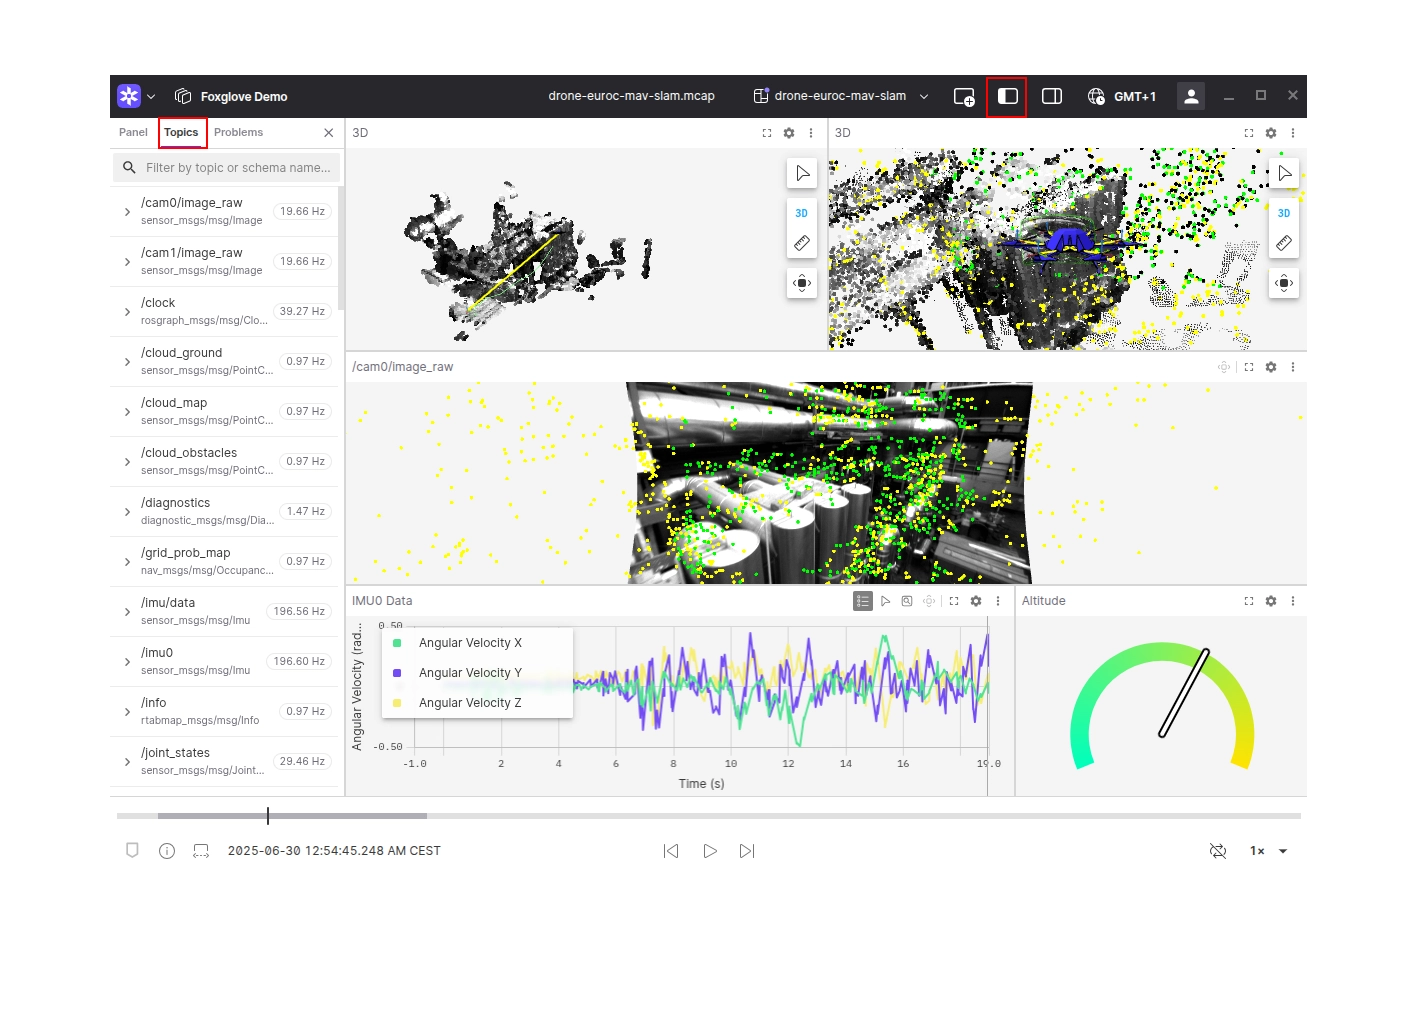
Your data is now available for exploring in Foxglove. Add some panels to begin visualizing what your robot is seeing and producing. Not sure where to start? Try adding a Raw Messages panel, Plot panel, or 3D panel.
To list available topics, open the left sidebar and open the Topics tab.
Links and resources
- SDK documentation with a more detailed example
- Jupyter notebook integration
- Python reference
- Source code with additional examples