Foxglove Documentation
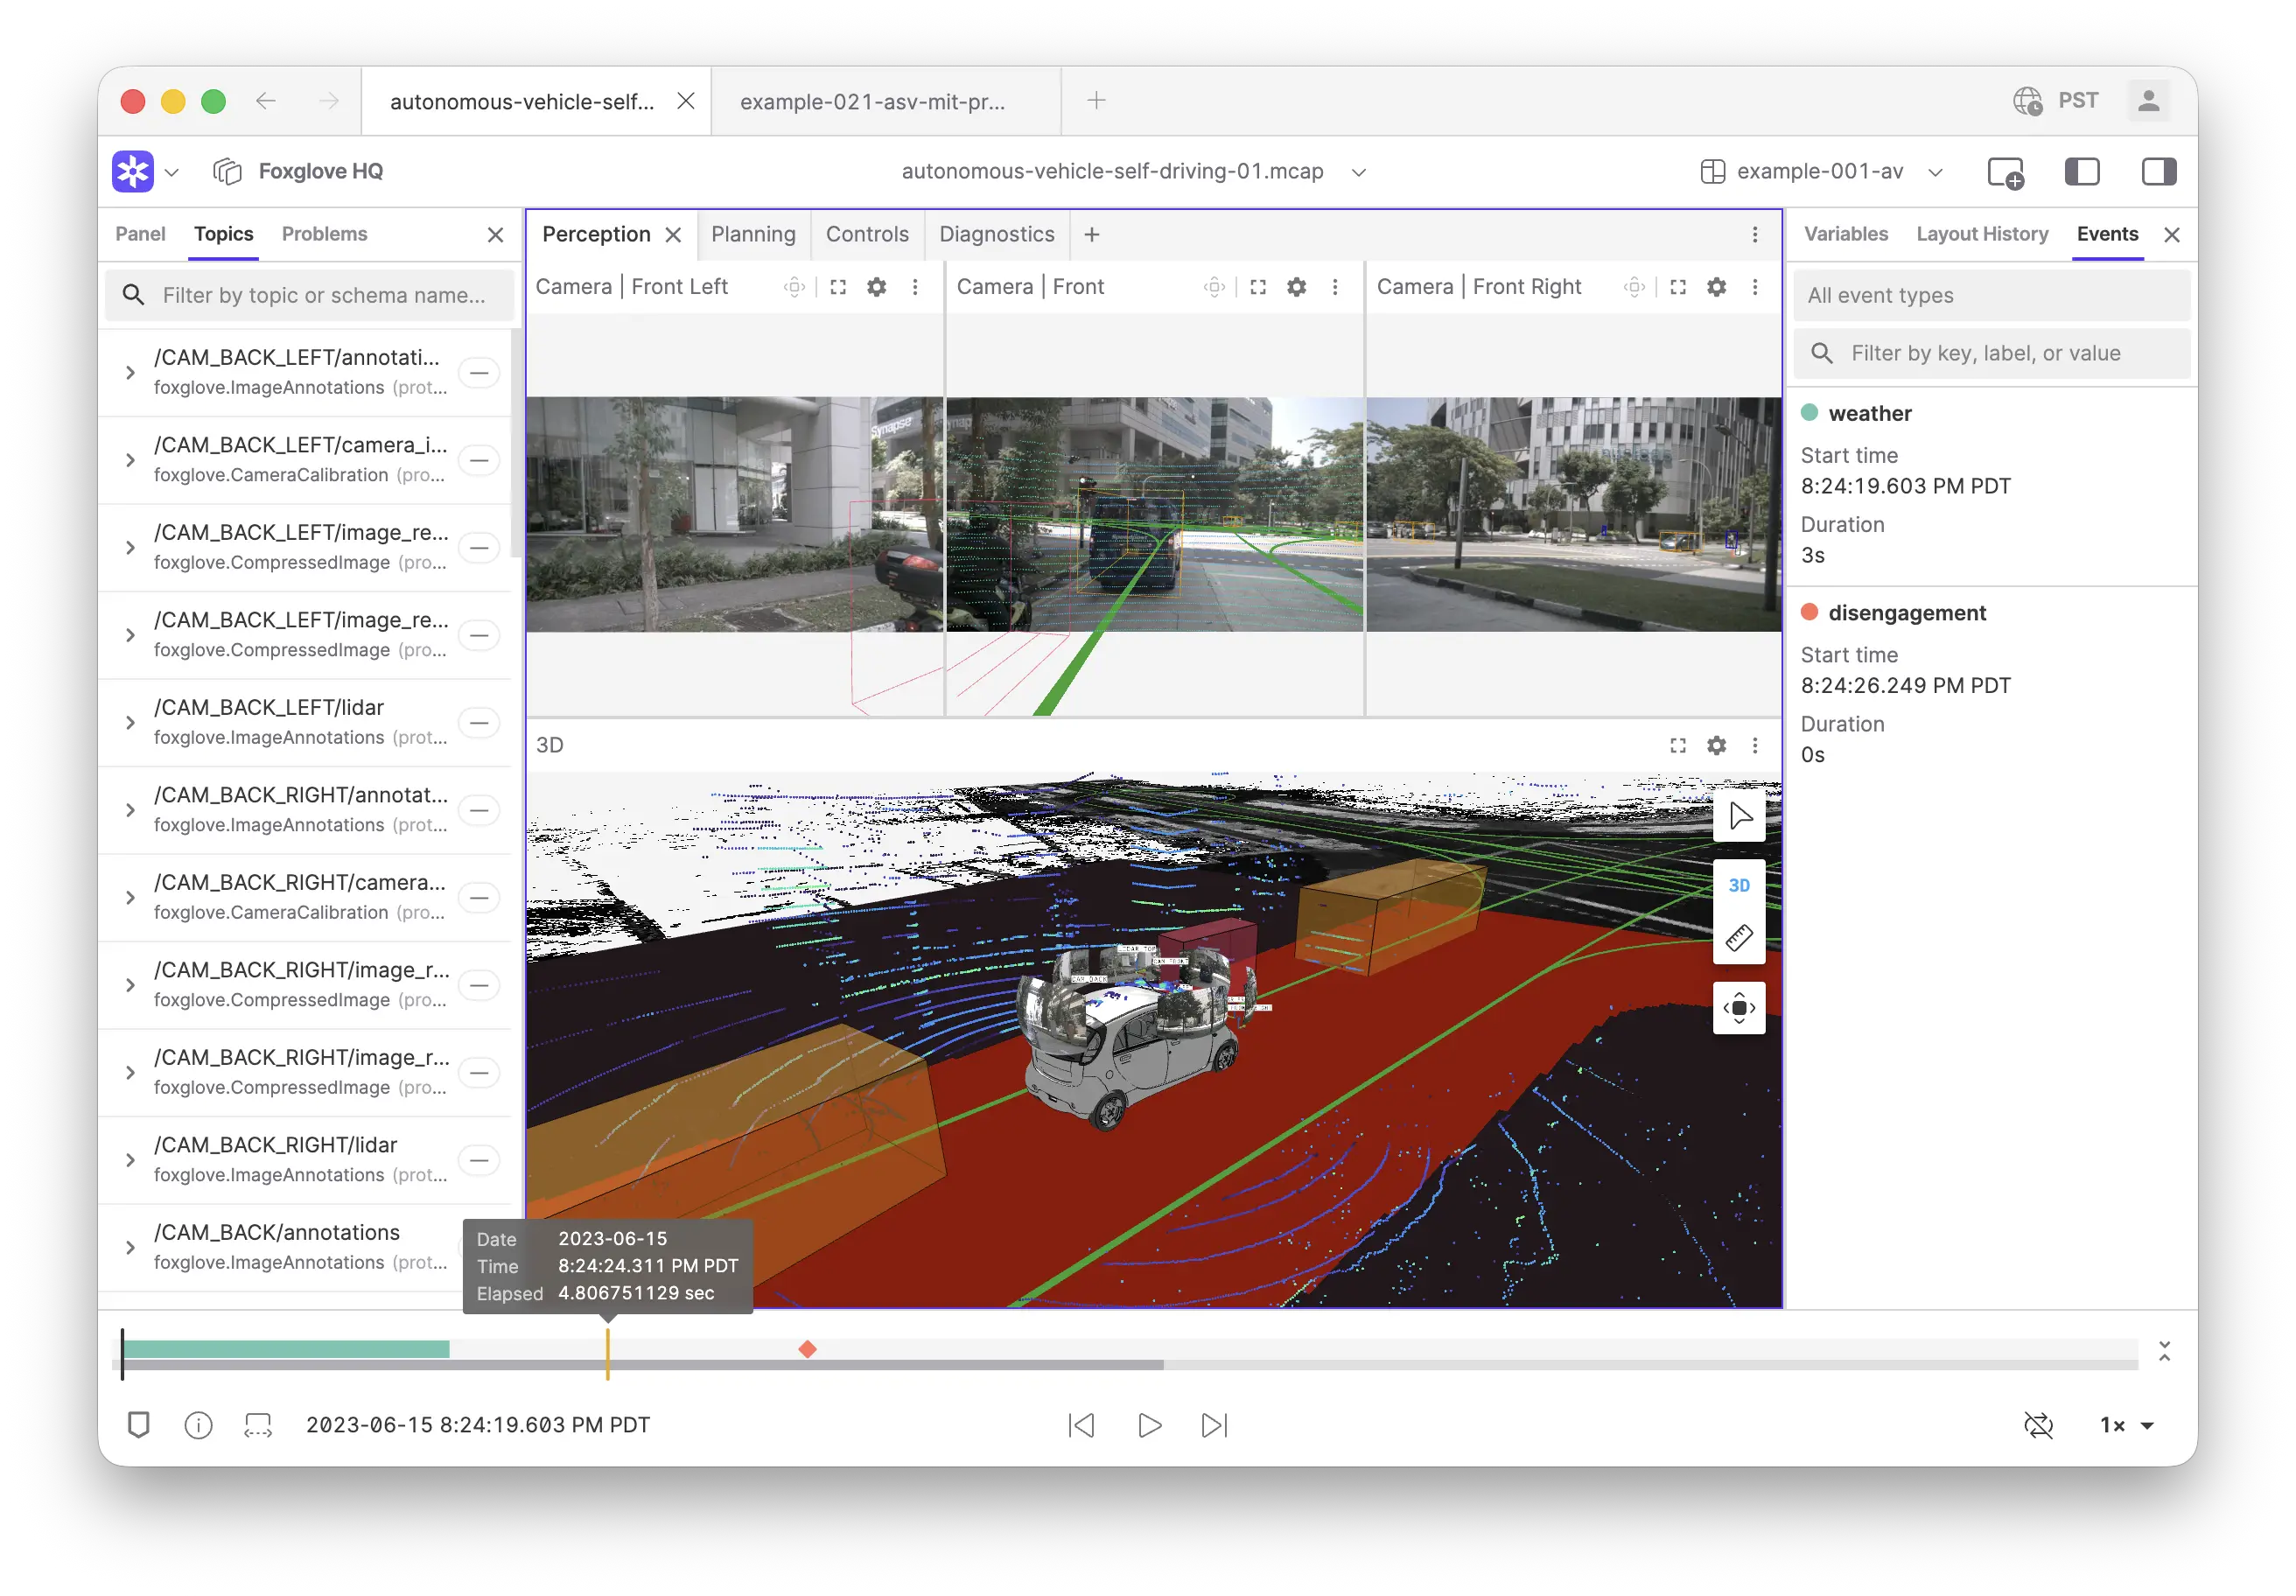
Foxglove is a platform to record, upload, organize, and visualize multimodal log data such as time series, text logs, video, 3D, maps, and more. It is most often used in hardware, robotics, and physical AI.
Foxglove components
Foxglove provides a collection of tools that together support the entire data lifecycle for robotics teams.
| Component | What it is | Where it runs | How to access it |
|---|---|---|---|
| Foxglove app | The main app through which Foxglove functionality can be accessed: visualization and debugging (panels, layouts, and playback), data organization, search, settings, and more. | In a desktop app or in the browser | |
| Data Platform | Hosted storage, indexing, and search for your robotics data — recordings, devices, and events. This is the backbone of all collaboration, organization, and search functionality in Foxglove. | Runs on Primary Sites, available in multiple flavors:
| |
| The software that runs on robots |
| Your robots, though SDK code can also run on your local machine |
Workflows
Foxglove supports all aspects of the multimodal data lifecycle:
Record
Ingest
- Automatically upload recorded files (ROS 1 bag and MCAP) through the Foxglove Agent running on your robot
- Import recordings into the Data Platform using the Foxglove app
Organize
- Index imported data recordings by device, time, and topic
- Annotate logs with metadata and events for easier search and discovery
- Search for interesting moments across all your recordings
- Share recordings with team members to triage incidents and analyze the root cause of an issue
Visualize
- Connect to live robot data to visualize or teleoperate using the Foxglove app
- Open a variety of supported formats (MCAP, ROS Bag, ULog, etc) locally using the Foxglove app
- Visualize recordings in the cloud, from your organization's Data Platform or remote HTTP servers
- Configure panels to understand how your robots sense, think, and act
- Create shared layouts to tackle repeated visualization and debugging tasks
Integrate
- Configure webhooks to react to data updates such as a new recording, event creation, or device update
- Automate aspects of your data pipeline using the API and CLI
Command palette
The command palette provides quick access to actions and navigation across the app. Open it with Ctrl + K (Windows and Linux) or Cmd + K (macOS) to search for commands by name or keyword.
Use the command palette to:
- Open data sources — Open local files, start a live connection, or open a recording
- Navigate — Jump to pages like the dashboard, settings, devices, recordings, events, or timeline
- Switch layouts — Browse and switch between recent, personal, and organization layouts
- Access help — Open the documentation, view version info, or launch the getting started guide
Start typing to filter the list. Some commands have sub-menus that expand when selected. For example, selecting "Change layout" drills down into a searchable list of available layouts. Use the mouse or arrow keys to navigate, click a list entry or press Enter to select, and Esc or click outside the list to close the palette.
Available commands are context-aware, meaning some only appear on certain pages.
Links and resources
- Create a free account
- Download the desktop app (for Linux, Windows, and macOS)
- Browse tutorials