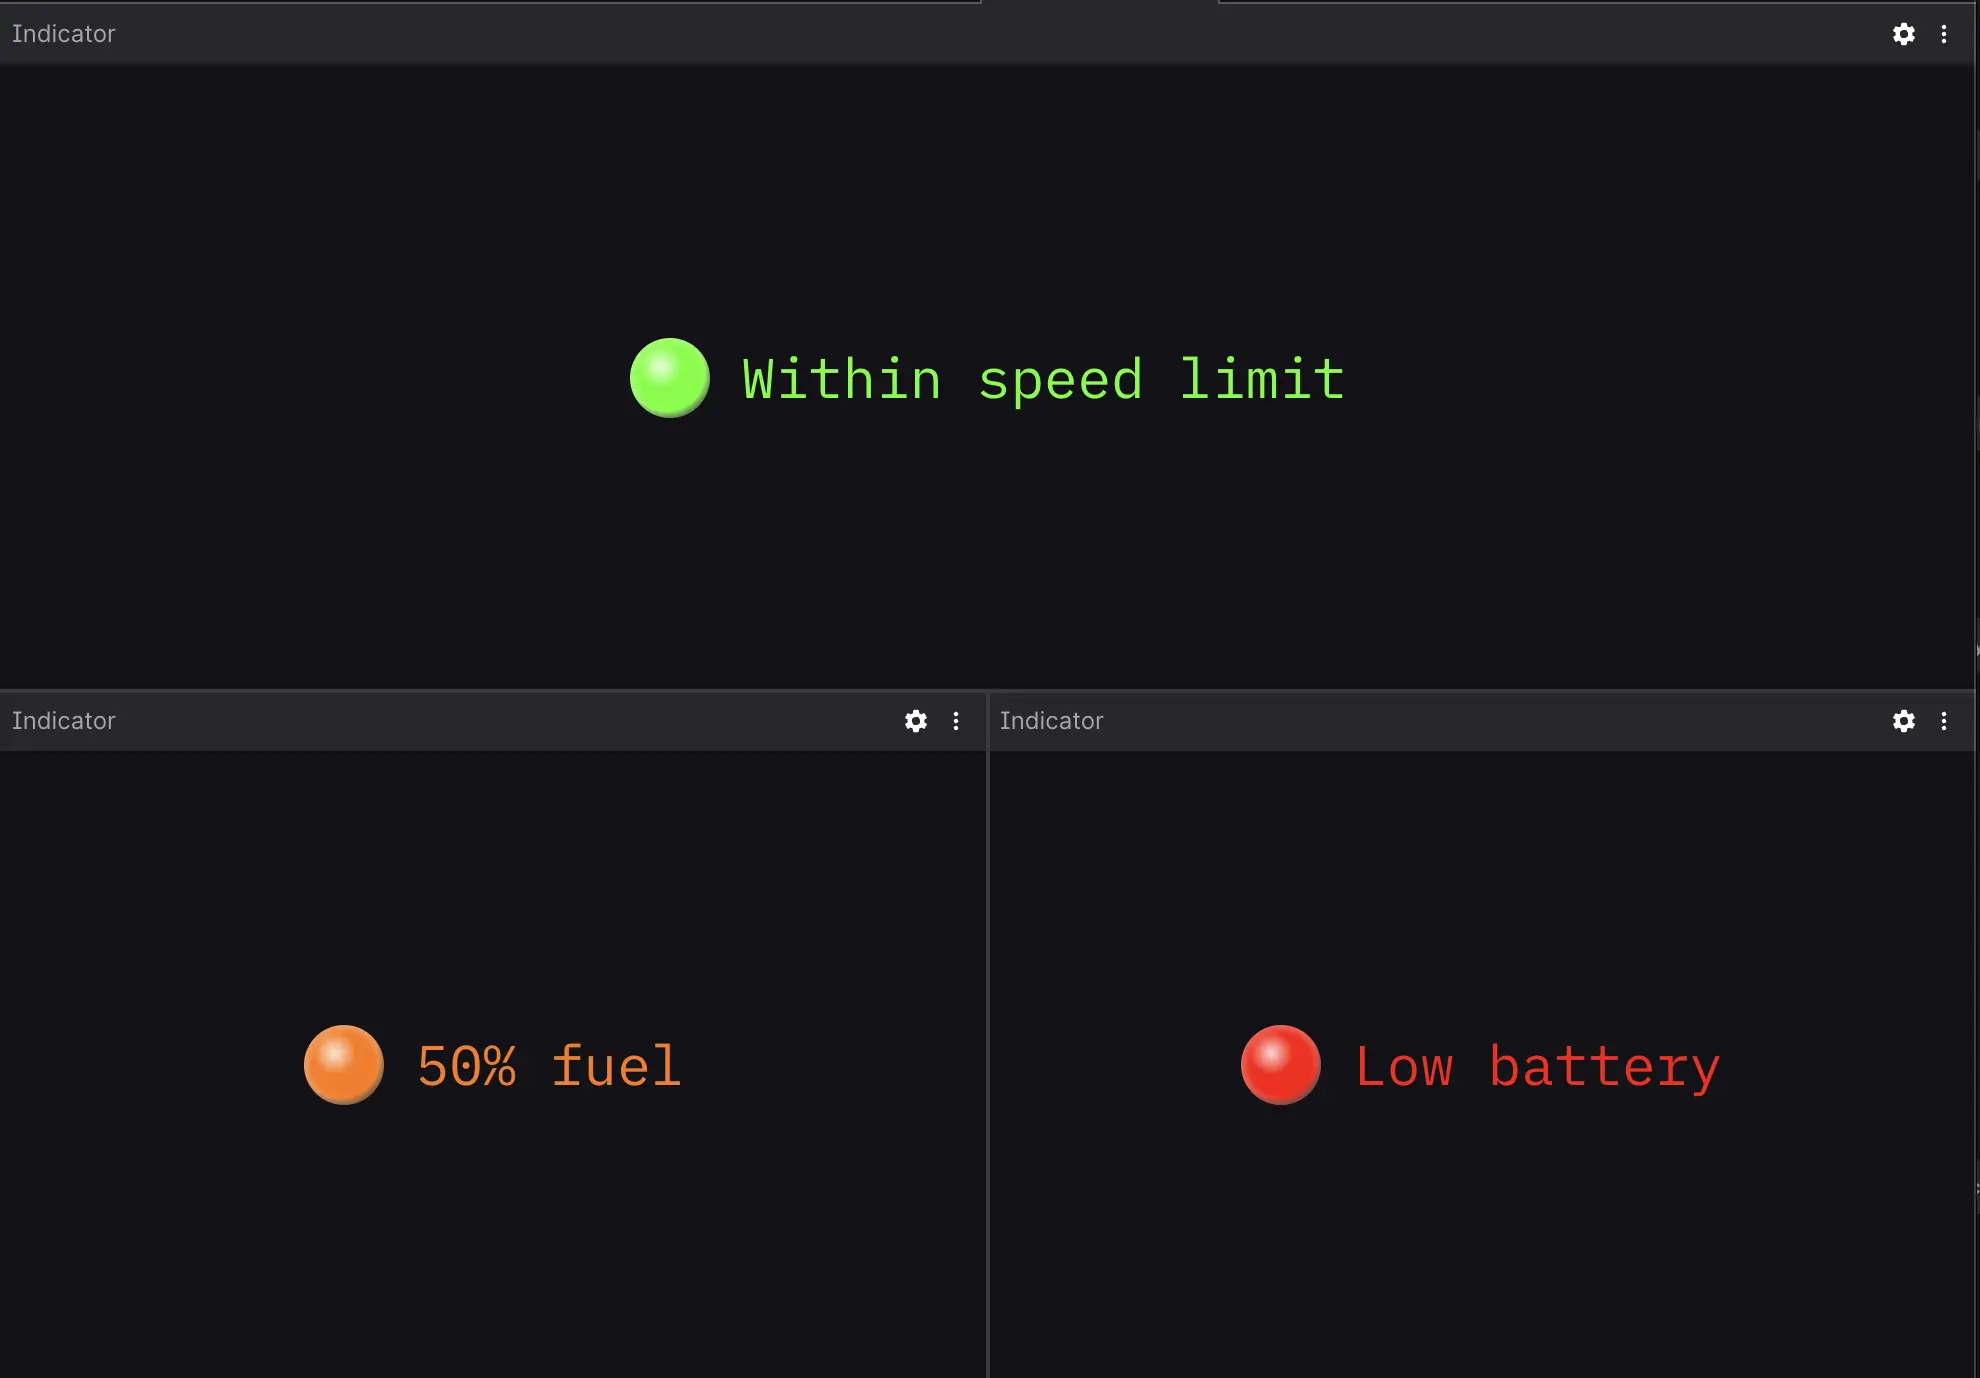
Indicator panel
Display a color-coded label to indicate threshold values in your data.
Message path functions can be appended to the path using .@name syntax:
Settings
General
| field | description |
|---|---|
| Data | Message path to the data |
| Style | Style of indicator ("Bulb" or "Background") |
Rules (first matching rule wins)
Add, edit, and reorder the rules for when the indicator should display different colors or labels. To change precedence, drag a rule to a new position or use its action menu to move it up or down.
| field | description |
|---|---|
Comparison | How to evaluate incoming data against the 'Compare with' value ("Equal to", "Less than", "Less than or equal to", "Greater than", or "Greater than or equal to") |
Compare with | Threshold or reference value to compare against (string, number, or boolean) |
Color | Color to display when this rule matches |
Label | Text label to display when this rule matches |
Fallback label | Text label to display when no rule matches |
Fallback color | Color to display when no rule matches |