PX4
Visualize PX4 flight logs
Foxglove can open PX4 ULog (.ulg) files natively for visualization. ULog files contain flight data recorded by PX4 autopilots, including sensor readings, actuator outputs, and system state information.
Record flight data
PX4 automatically logs flight data to ULog files when the autopilot is armed. The logs are typically stored on the SD card or in the log directory on your flight controller.
To manually start logging or configure logging parameters, use the PX4 command line interface or QGroundControl. For more details on recording and managing ULog files, see the PX4 logging documentation.
Open your recording
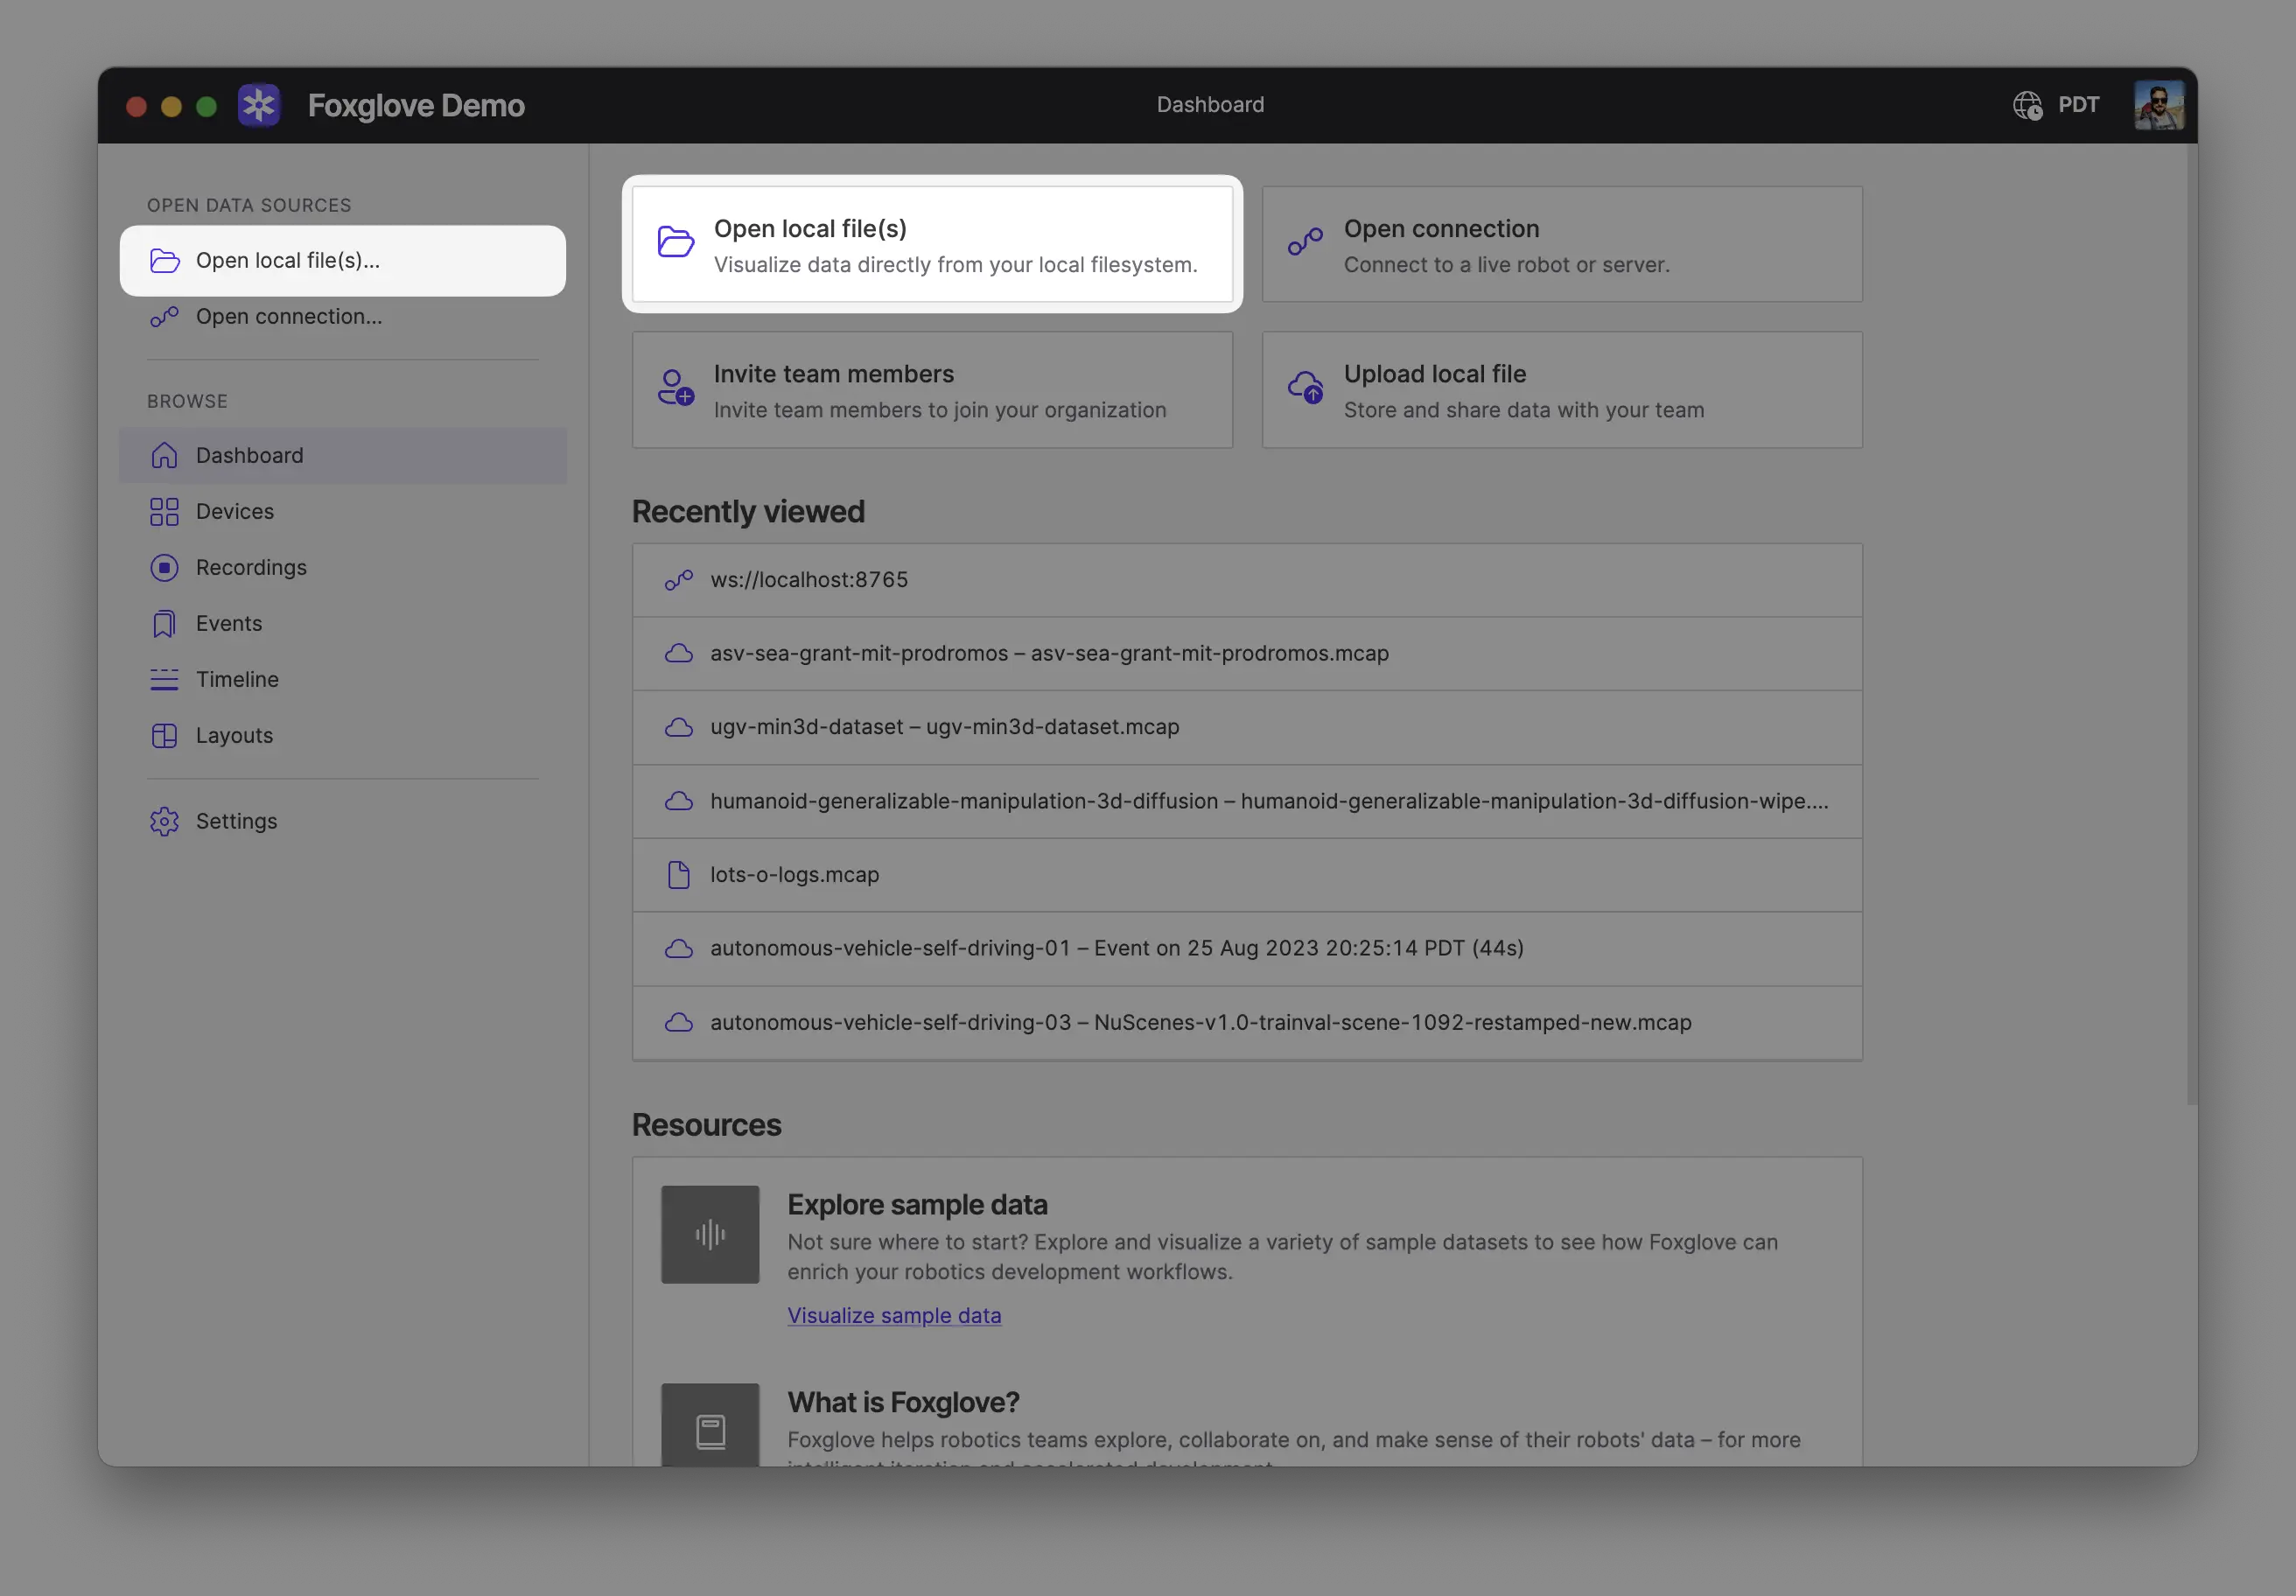
Open your recording(s) directly from your computer by:
- Dragging and dropping them into Foxglove
- Using
Cmd/Ctrl + o - Clicking Open local file(s) in the app
When opening multiple files, Foxglove will display the data as a single merged timeline. The files must be of the same format.
Explore your data
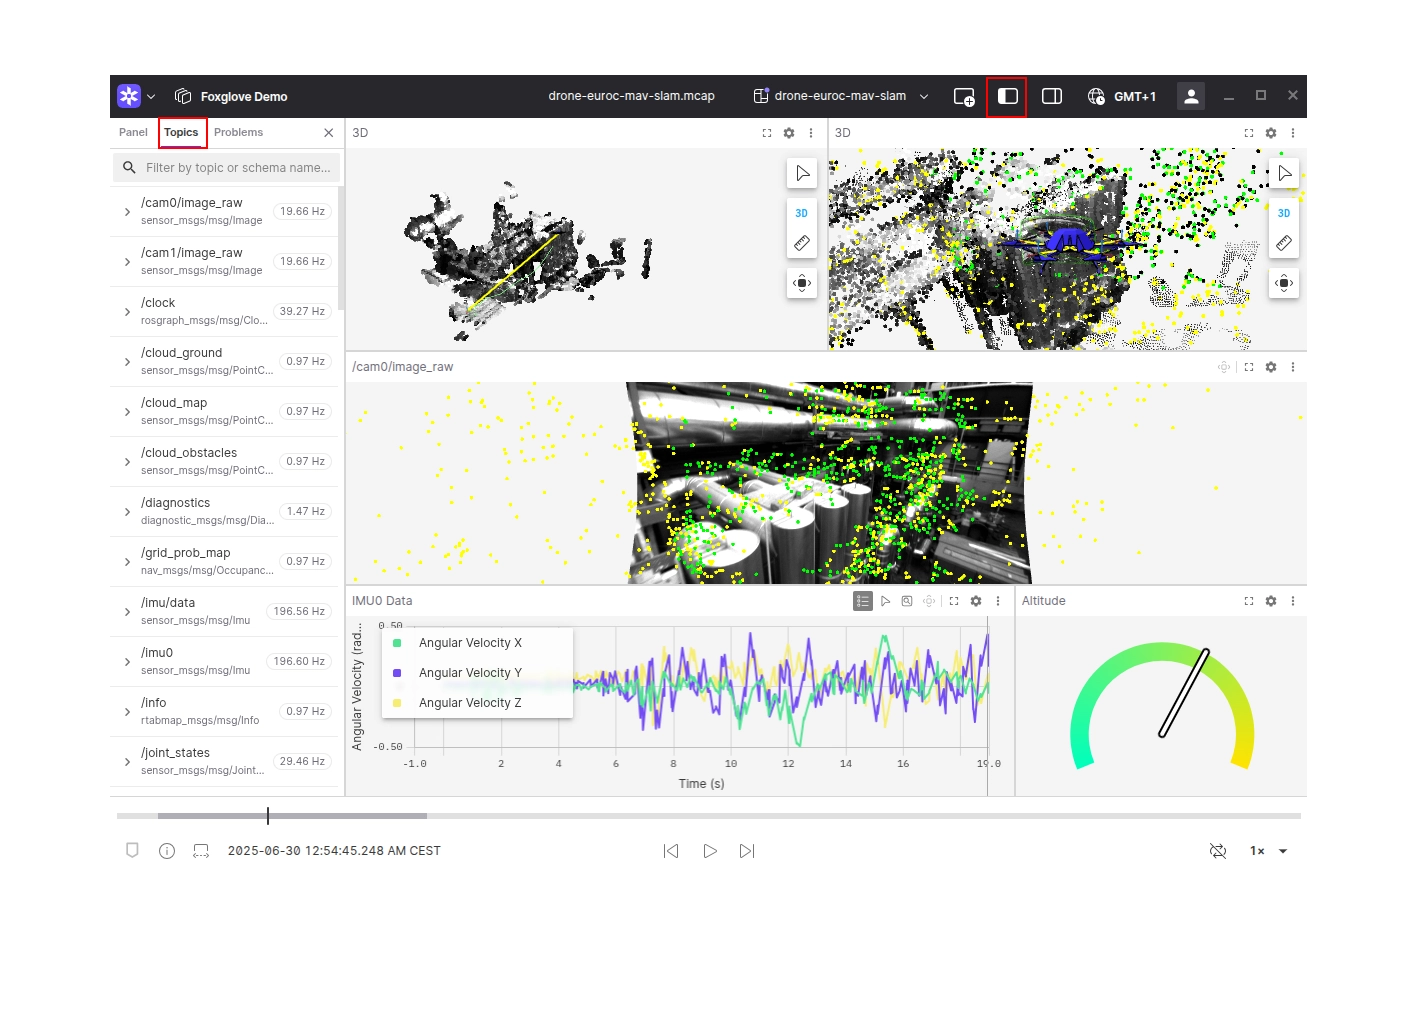
Your data is now available for exploring in Foxglove. Add some panels to begin visualizing what your robot is seeing and producing. Not sure where to start? Try adding a Raw Messages panel, Plot panel, or 3D panel.
To list available topics, open the left sidebar and open the Topics tab.
PX4 Converter extension
The PX4 Converter extension translates selected UORB messages and creates Foxglove messages from them so that the PX4 data can be visualized in additional panels such as map and 3D.
To install the extension, navigate to Settings->Extensions, select PX4 Converter Extension, and click install.
Once installed, the messages will be automatically converted when you load the panels utilizing them.
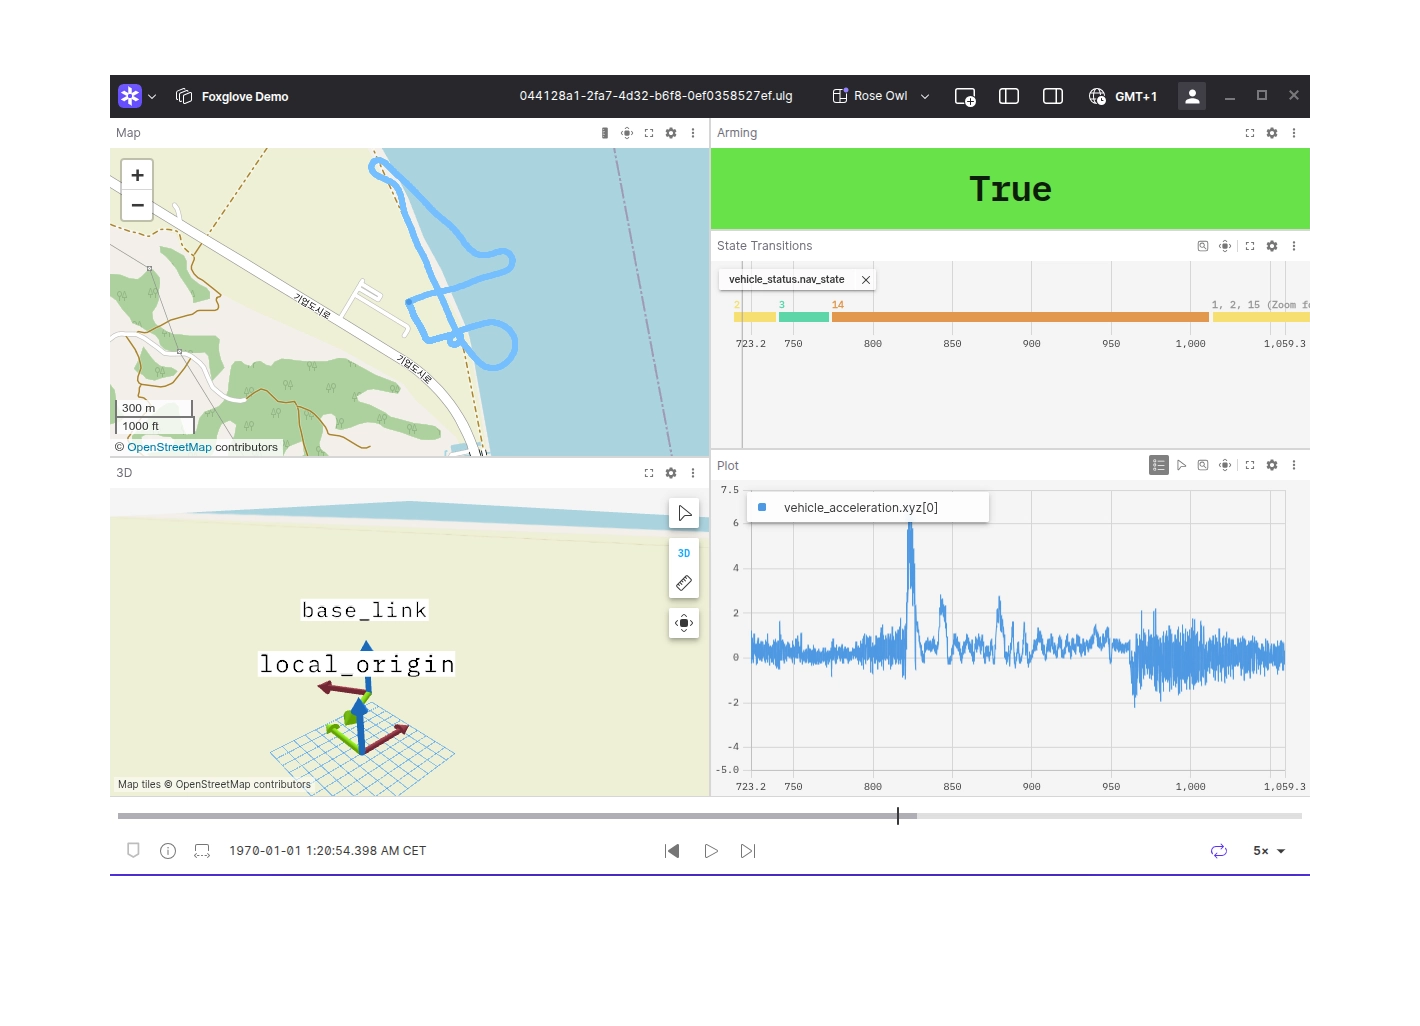
The converter will publish the following frame transforms:
local_origin- an ENU frame matching the EKF2 initialization framebase_intermediate- an ENU intermediate frame containing the local position of the aircraft and yawbase_link- same as base_intermediate but with applied Roll and Pitch angles
Learn more
- PX4 Converter extension
- Explore all of the panels Foxglove has to offer for viewing and exploring data
- Create and save sets of panels and their settings as layouts to reuse them or share with teammates