ROS 1
- Open a live connection
- Play back recorded data
Visualize your robot live
The best way to visualize your live ROS 1 robot in Foxglove is using the Foxglove Bridge. It's written in C++ with sensible defaults to get you up and running quickly and is designed for high performance with low overhead. It's also highly configurable.
1. Install the Foxglove Bridge
Install and launch the Foxglove Bridge node:
sudo apt install ros-$ROS_DISTRO-foxglove-bridge
roslaunch --screen foxglove_bridge foxglove_bridge.launch
The Foxglove Bridge will automatically subscribe to all topics in your ROS system and make them available for live visualization over WebSocket.
For ROS 1 distributions older than Melodic, you will have to build from source.
2. Connect to your robot:
Ensure Foxglove Bridge is running.
Make sure you are on the same network as your robot. In Foxglove, select Open connection from the dashboard or left-hand menu.
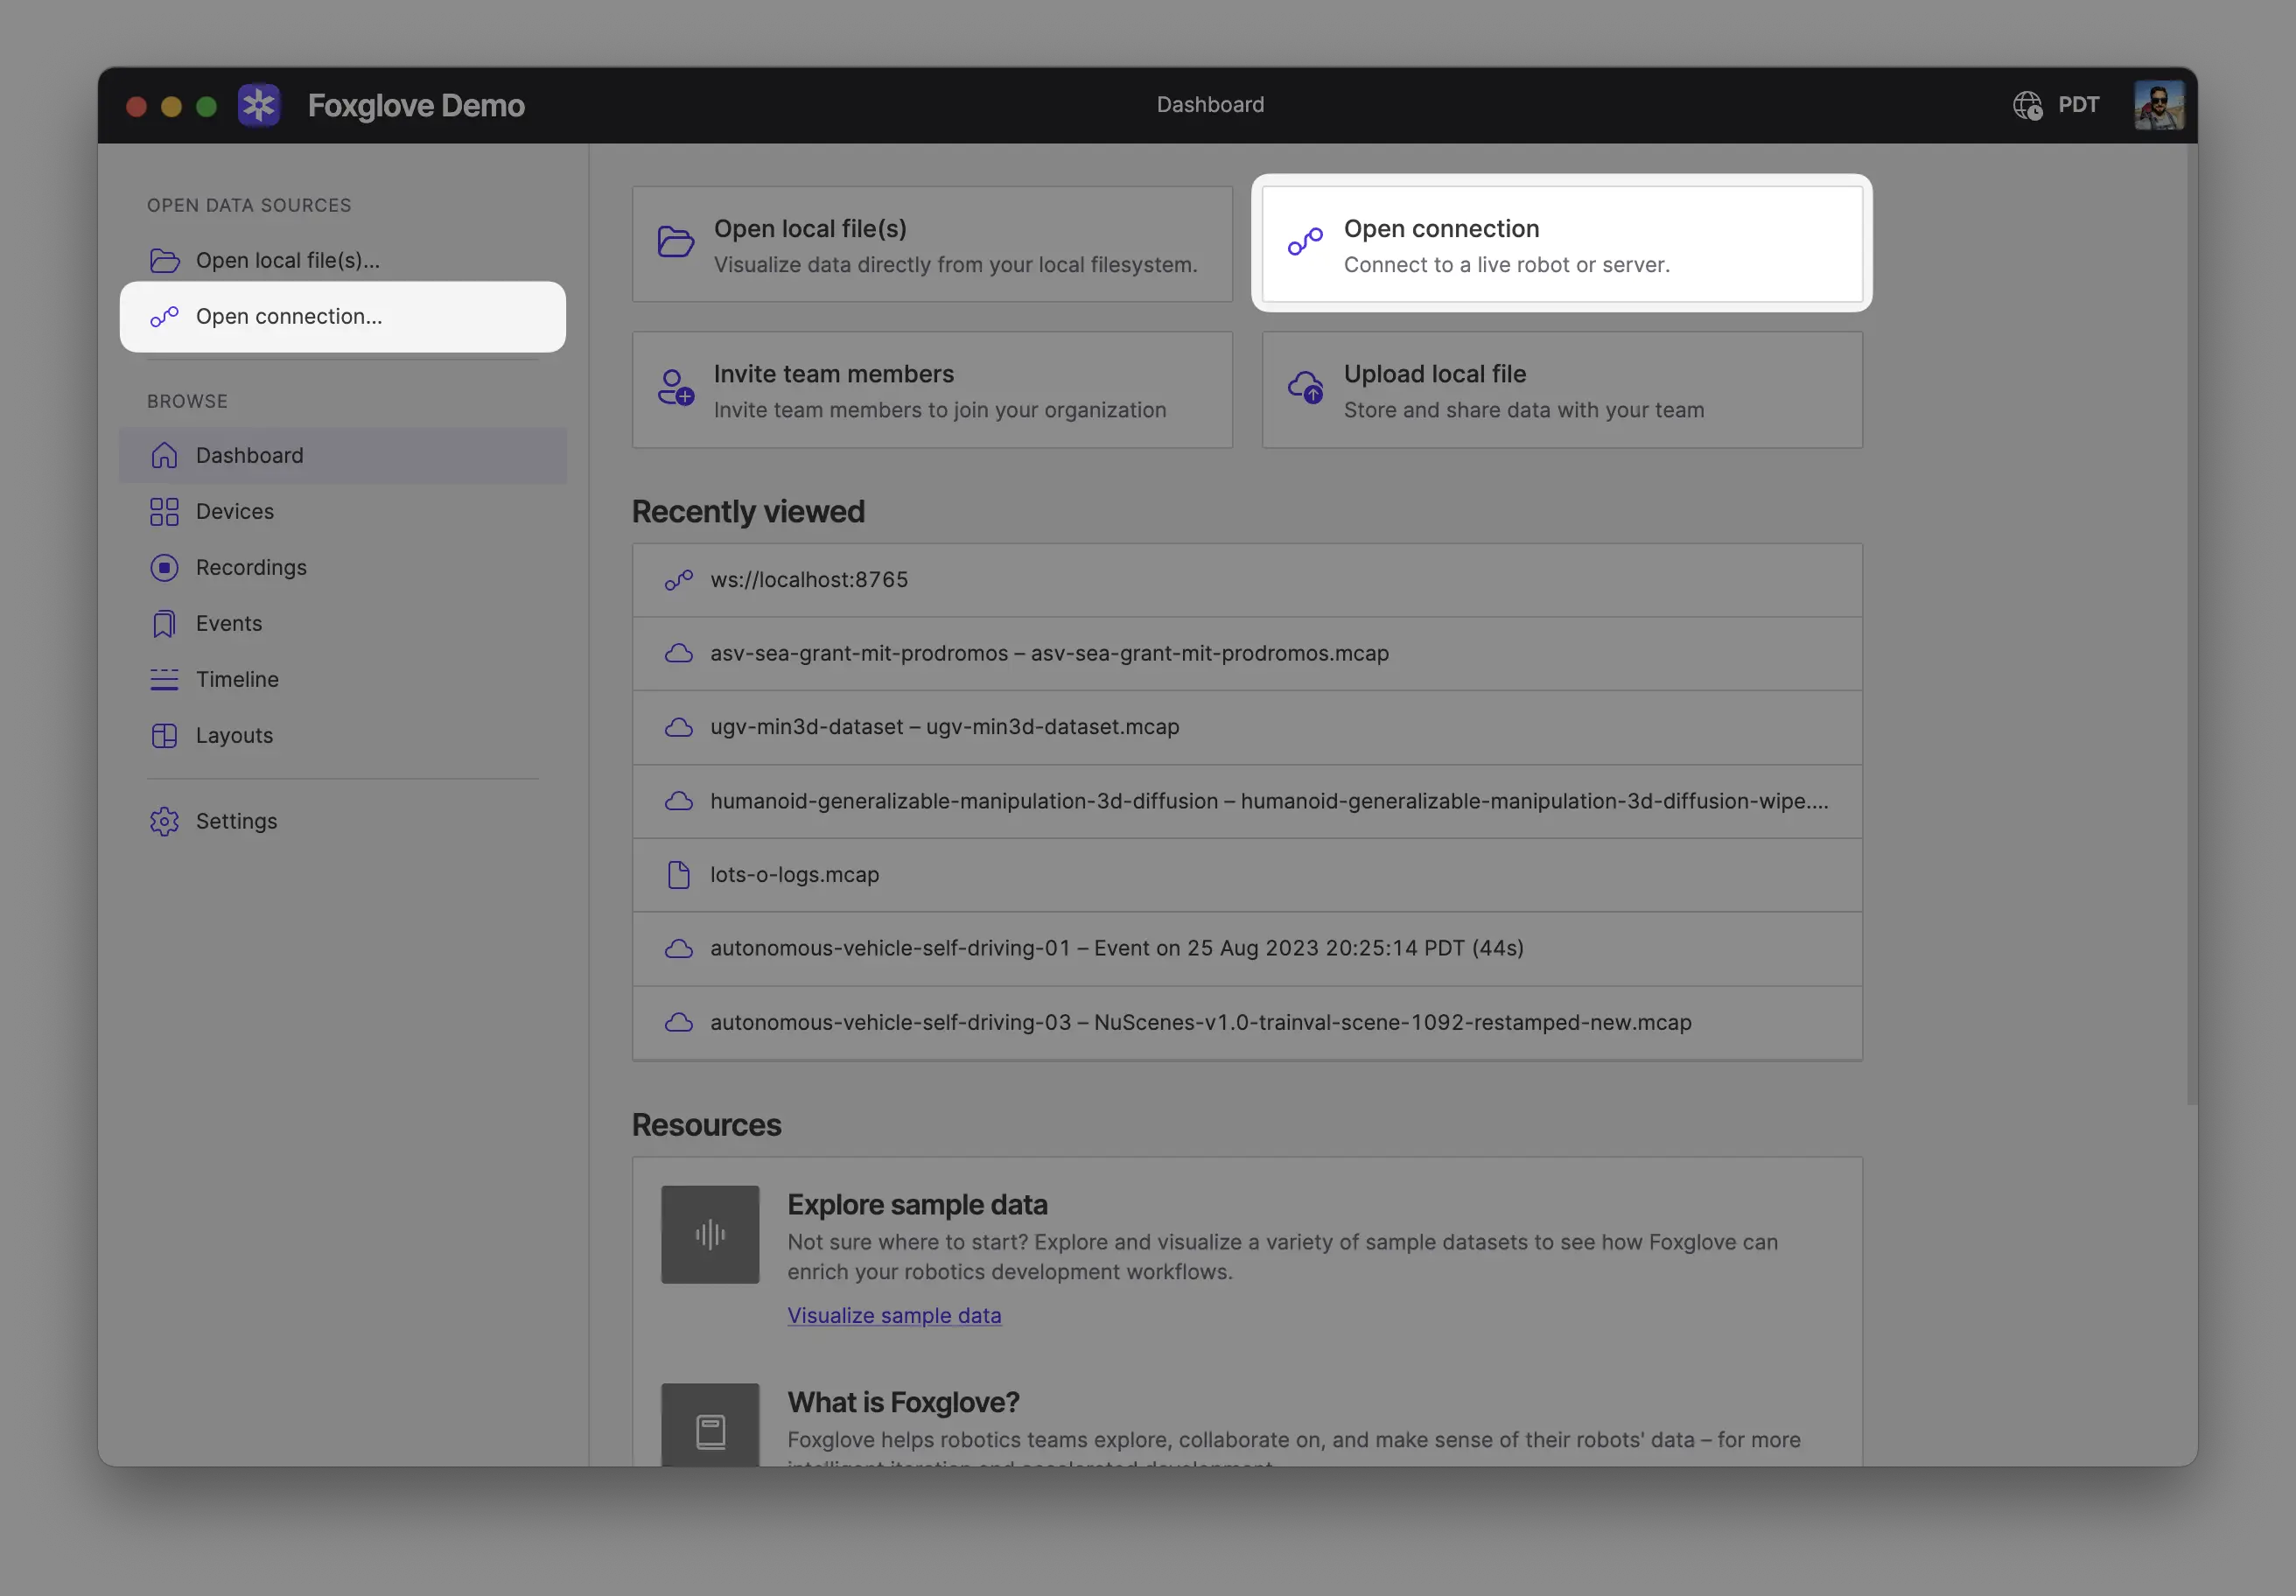
Select Foxglove WebSocket in the Open a new connection dialog, then enter the URL of the server:
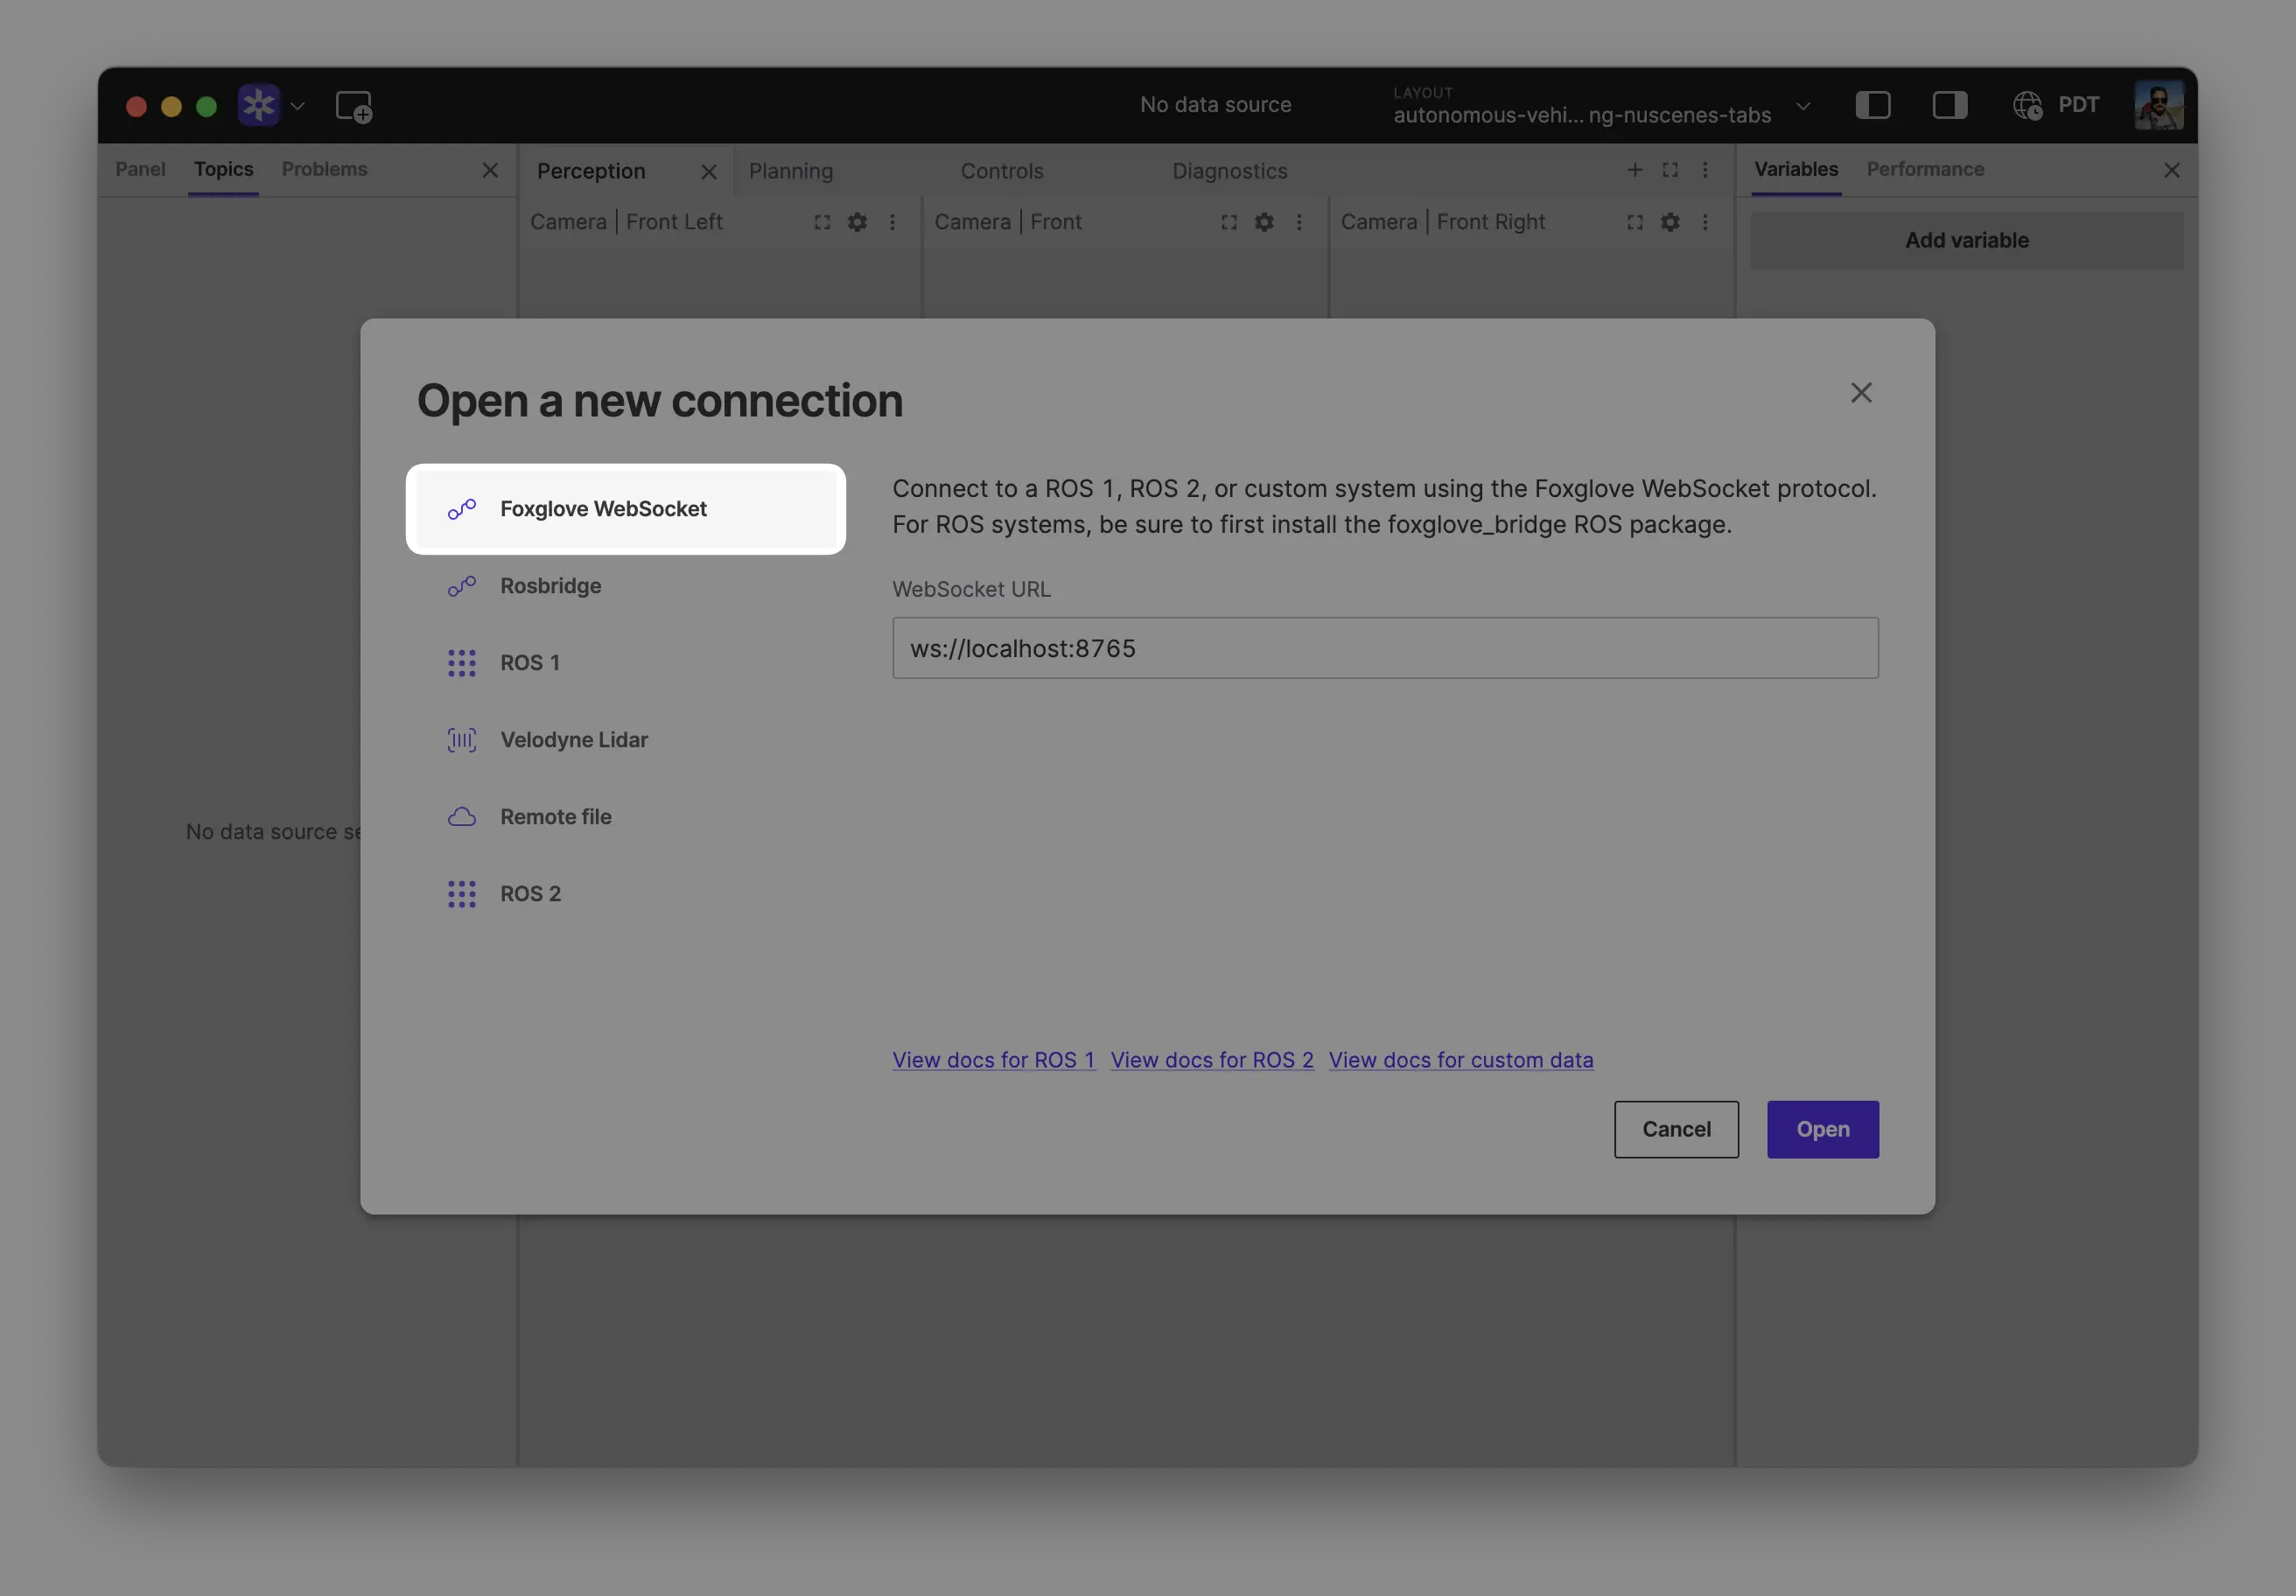
Click "Open" to connect.
Local development: Use ws://localhost:8765 when running the server on the same machine as Foxglove.
Robot connection: Use ws://ROBOT_IP:8765 when connecting to a server running on your robot, where ROBOT_IP is your robot's IP address on the network.
While Foxglove does support rosbridge and ROS 1 native connections, we recommend always using the Foxglove Bridge for the best features, performance, and stability.
Opening a rosbag
Foxglove can open .bag files natively. If you don’t have a .bag file, use the rosbag package to record data.
1. Record data
With your ROS stack running, record data on your robot:
rosbag record -a --duration=30
2. Open your recording
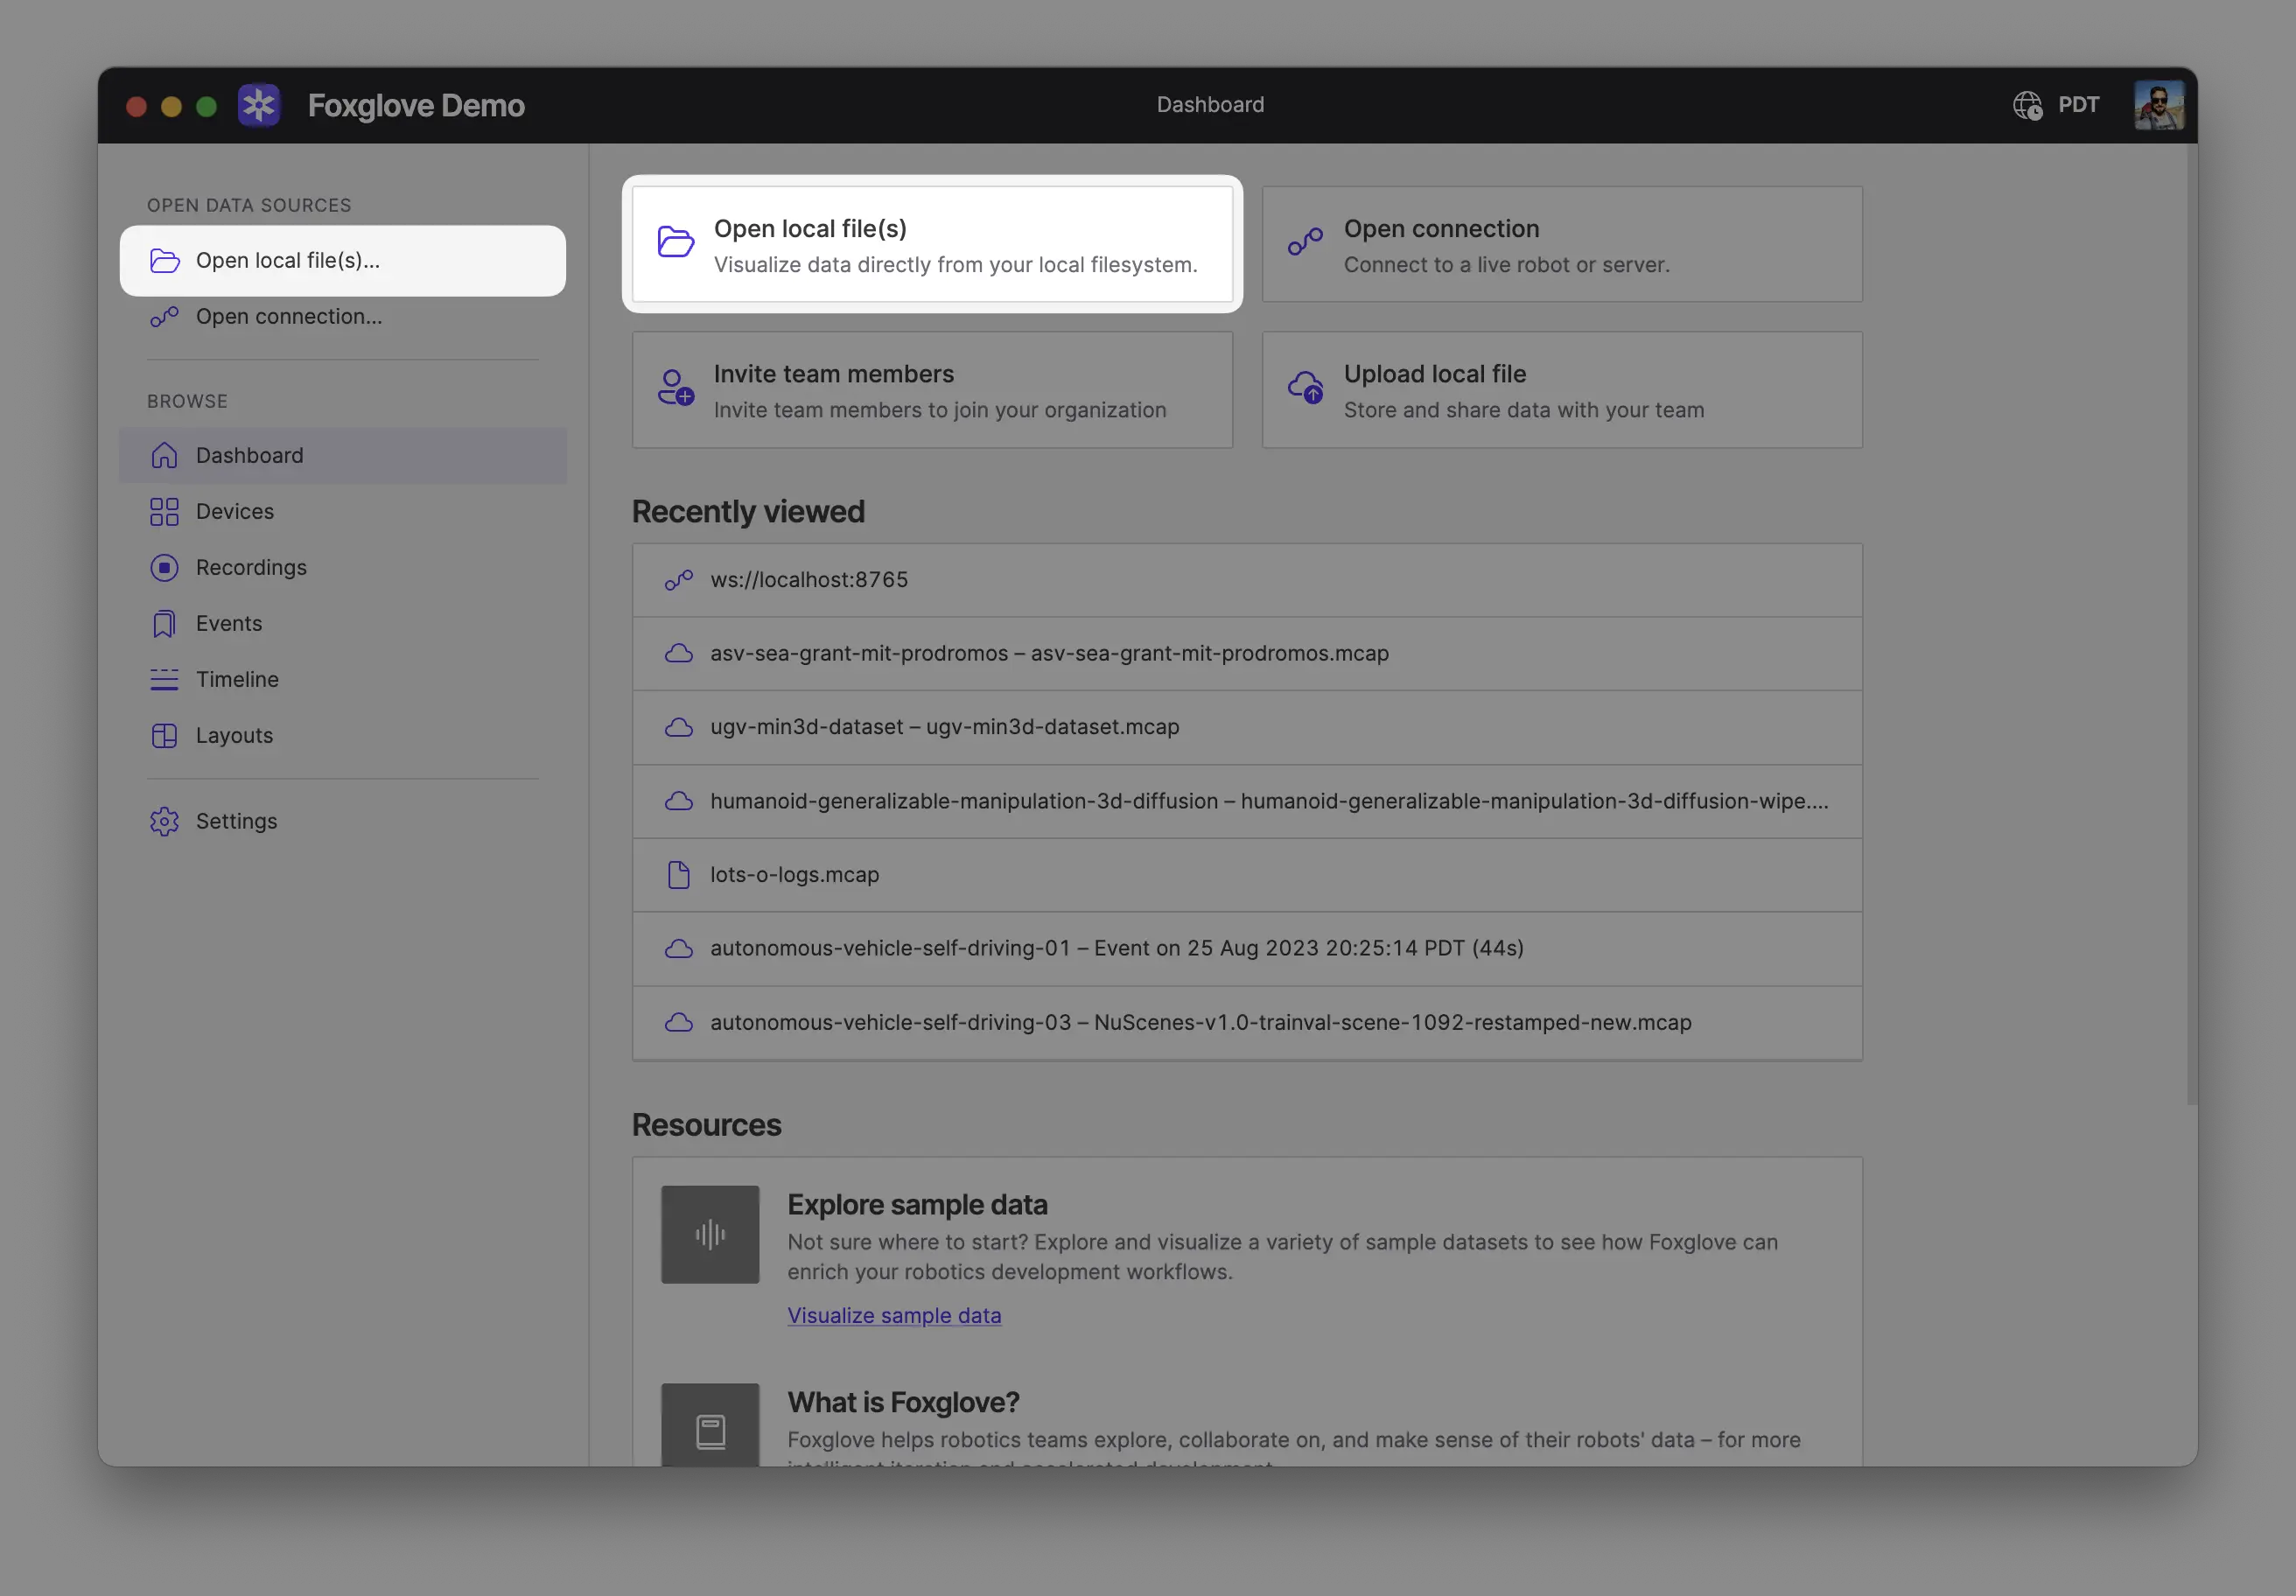
Open your recording(s) directly from your computer by:
- Dragging and dropping them into Foxglove
- Using
Cmd/Ctrl + o - Clicking Open local file(s) in the app
When opening multiple files, Foxglove will display the data as a single merged timeline. The files must be of the same format.
Explore your data
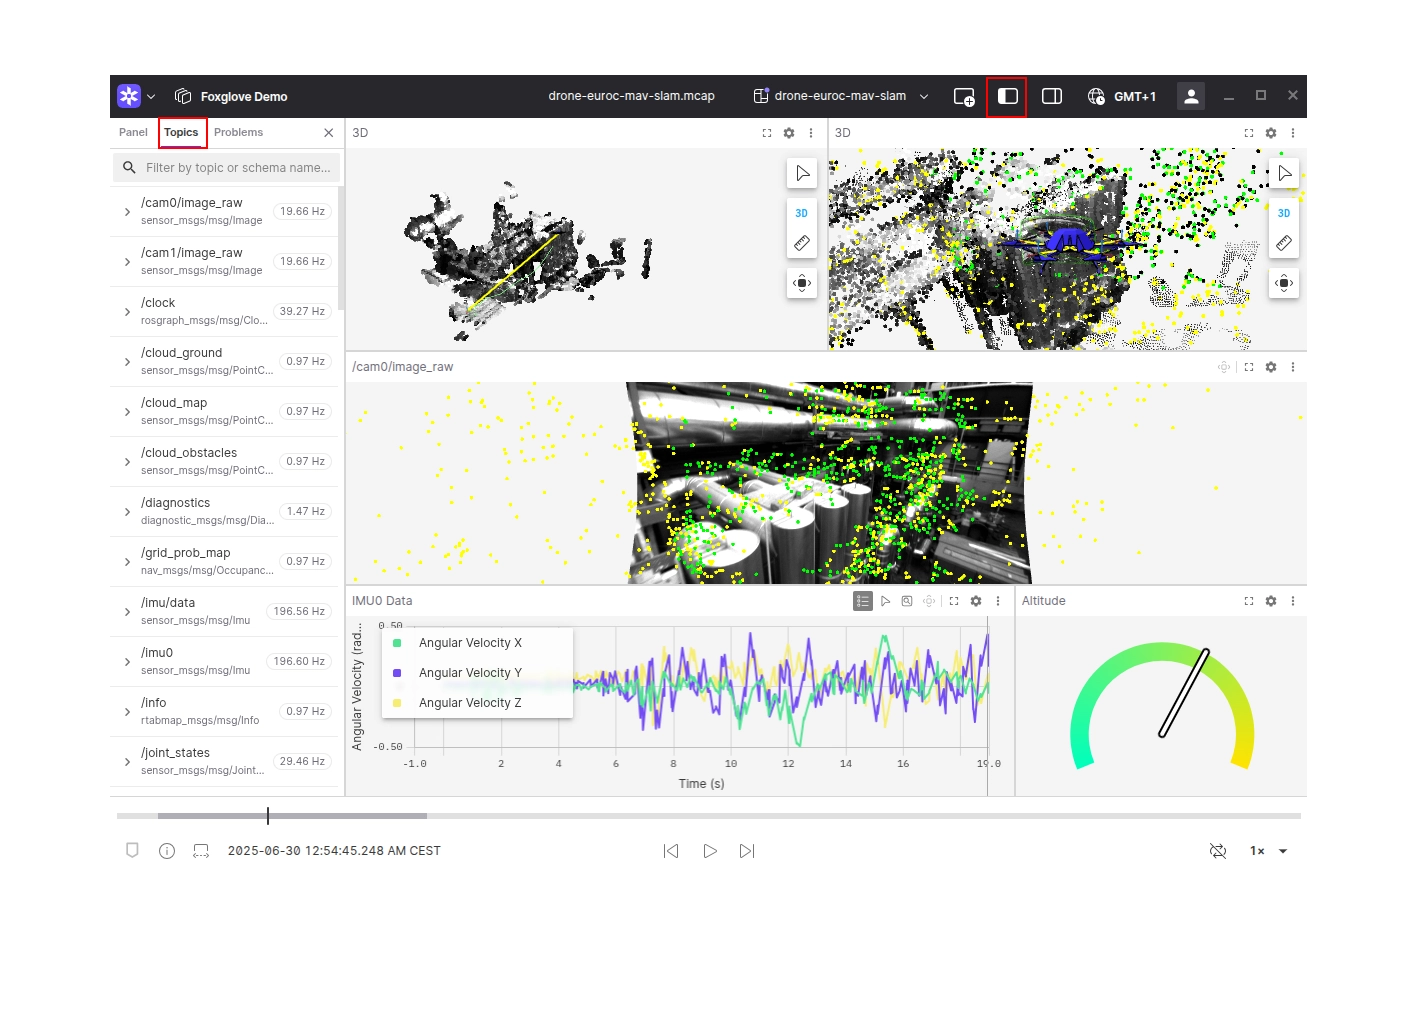
Your data is now available for exploring in Foxglove. Add some panels to begin visualizing what your robot is seeing and producing. Not sure where to start? Try adding a Raw Messages panel, Plot panel, or 3D panel.
To list available topics, open the left sidebar and open the Topics tab.
Learn more
- Explore all of the panels Foxglove has to offer for viewing and exploring data
- Create and save sets of panels and their setting as layouts to reuse them or share with teammates
- Use Foxglove Data Platform to store, stream, and share your robotics data