Foxglove v2.5.1
This release contains some minor bug fixes.
Fixes
- Fixed an issue with drag-and-drop that resulted in opening the dragged file too many times
- The Plot legend now correctly respects math modifiers used in message paths
Release notes for the Foxglove web and desktop app.
View All TagsThis release contains some minor bug fixes.
You can now manage and resize table columns on the Device and Event tables to customize how you view your data.
Visualization playback now supports displaying timestamps in RFC 3339 (ISO 8601) and 24-hour formats in addition to 12-hour and epoch.
When we launched Foxglove 2.0, we dropped the "Studio" name. In keeping with that, we renamed the @foxglove/studio
NPM package to @foxglove/extension
. Please update your custom extensions to depend on @foxglove/extension
to receive future SDK updates.
union
fields, vectors of unions, and fixed-length arraysid
recordingKey
id
We’ve improved the Foxglove client integration with ROS Services to allow Foxglove to be aware if a service is unavailable and the service has failed. The Foxglove WebSocket protocol now has a serviceCallFailure operation that can communicate to custom panels or the Foxglove Service Call panel when a call fails.
Did you know you can create reference lines in the Plot panel? Now you can adjust the size of reference lines to improve their visibility.
Buckle up for smoother video loading: We've made performance improvements to video playback so you get a low latency experience when visualizing multiple CompressedVideo topics at once.
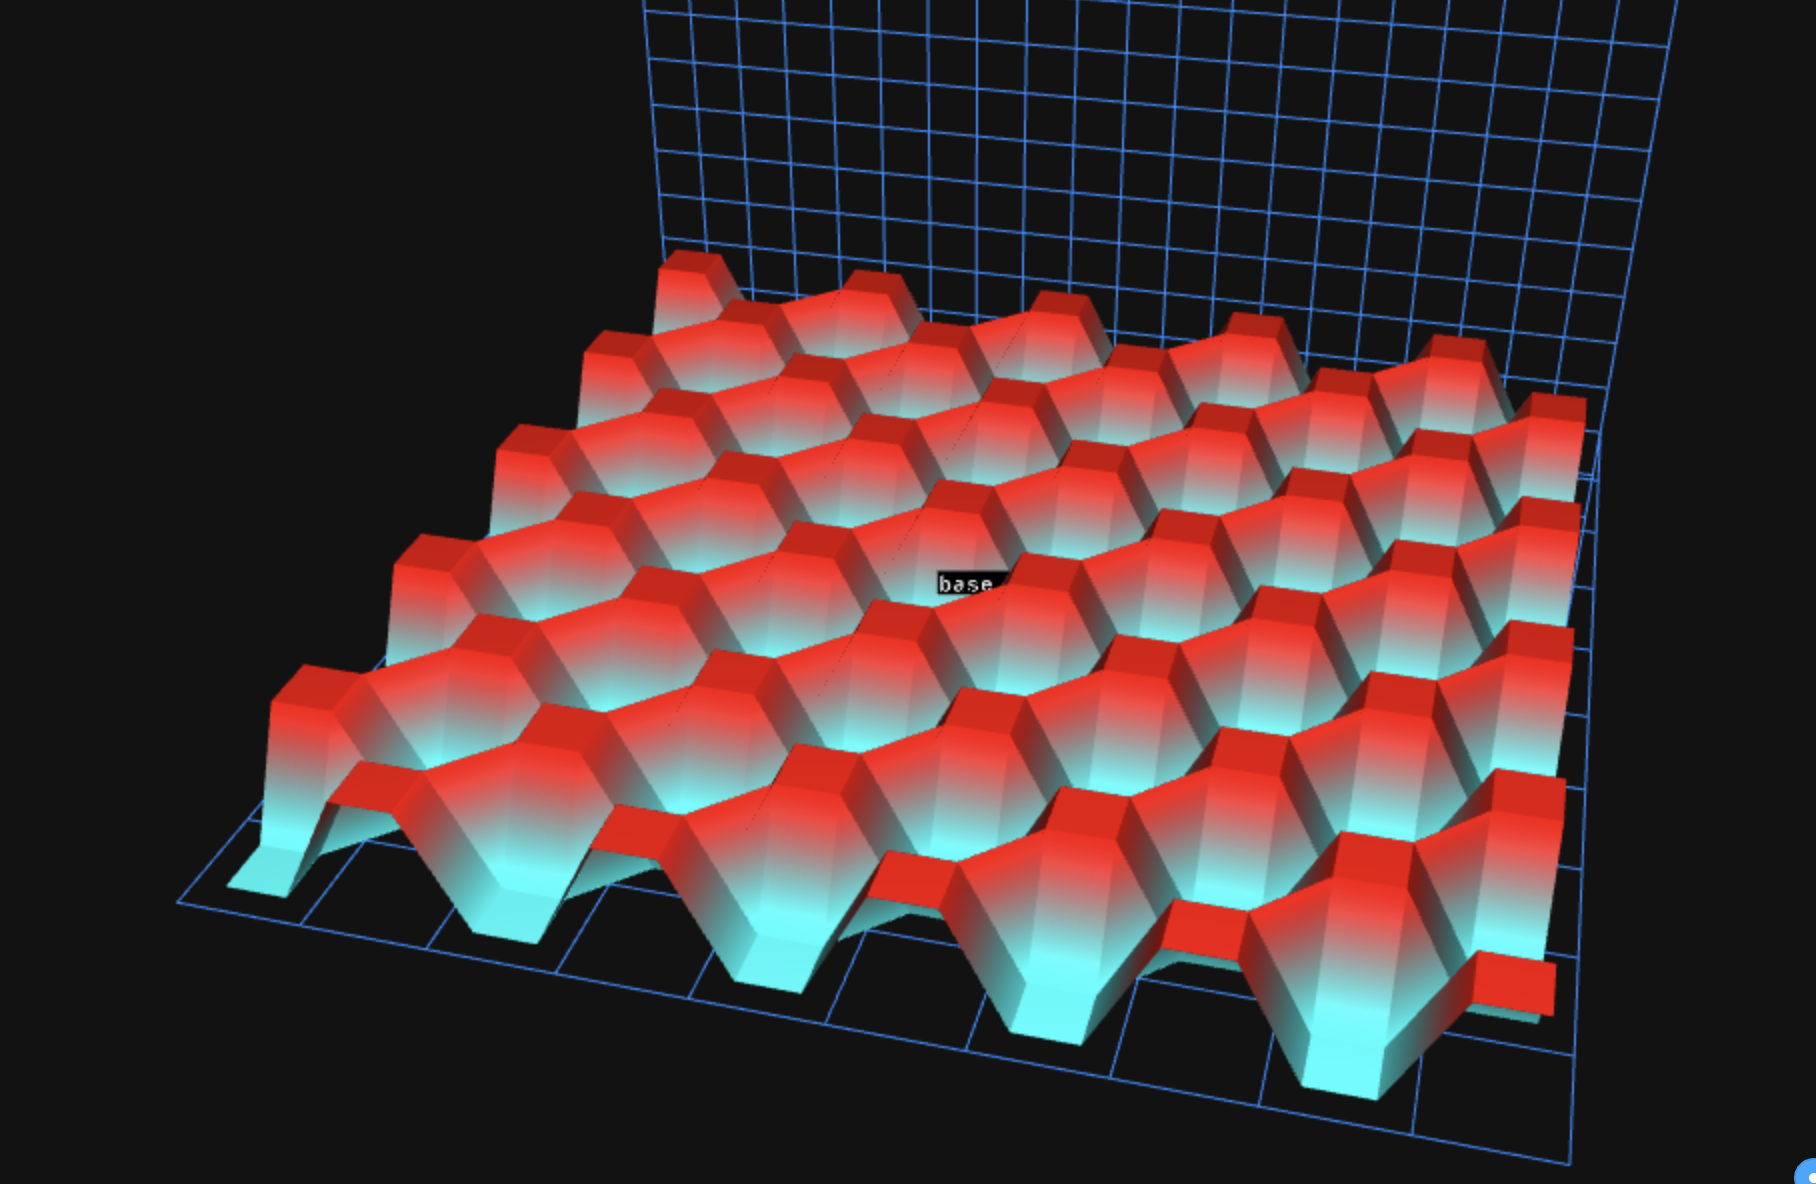
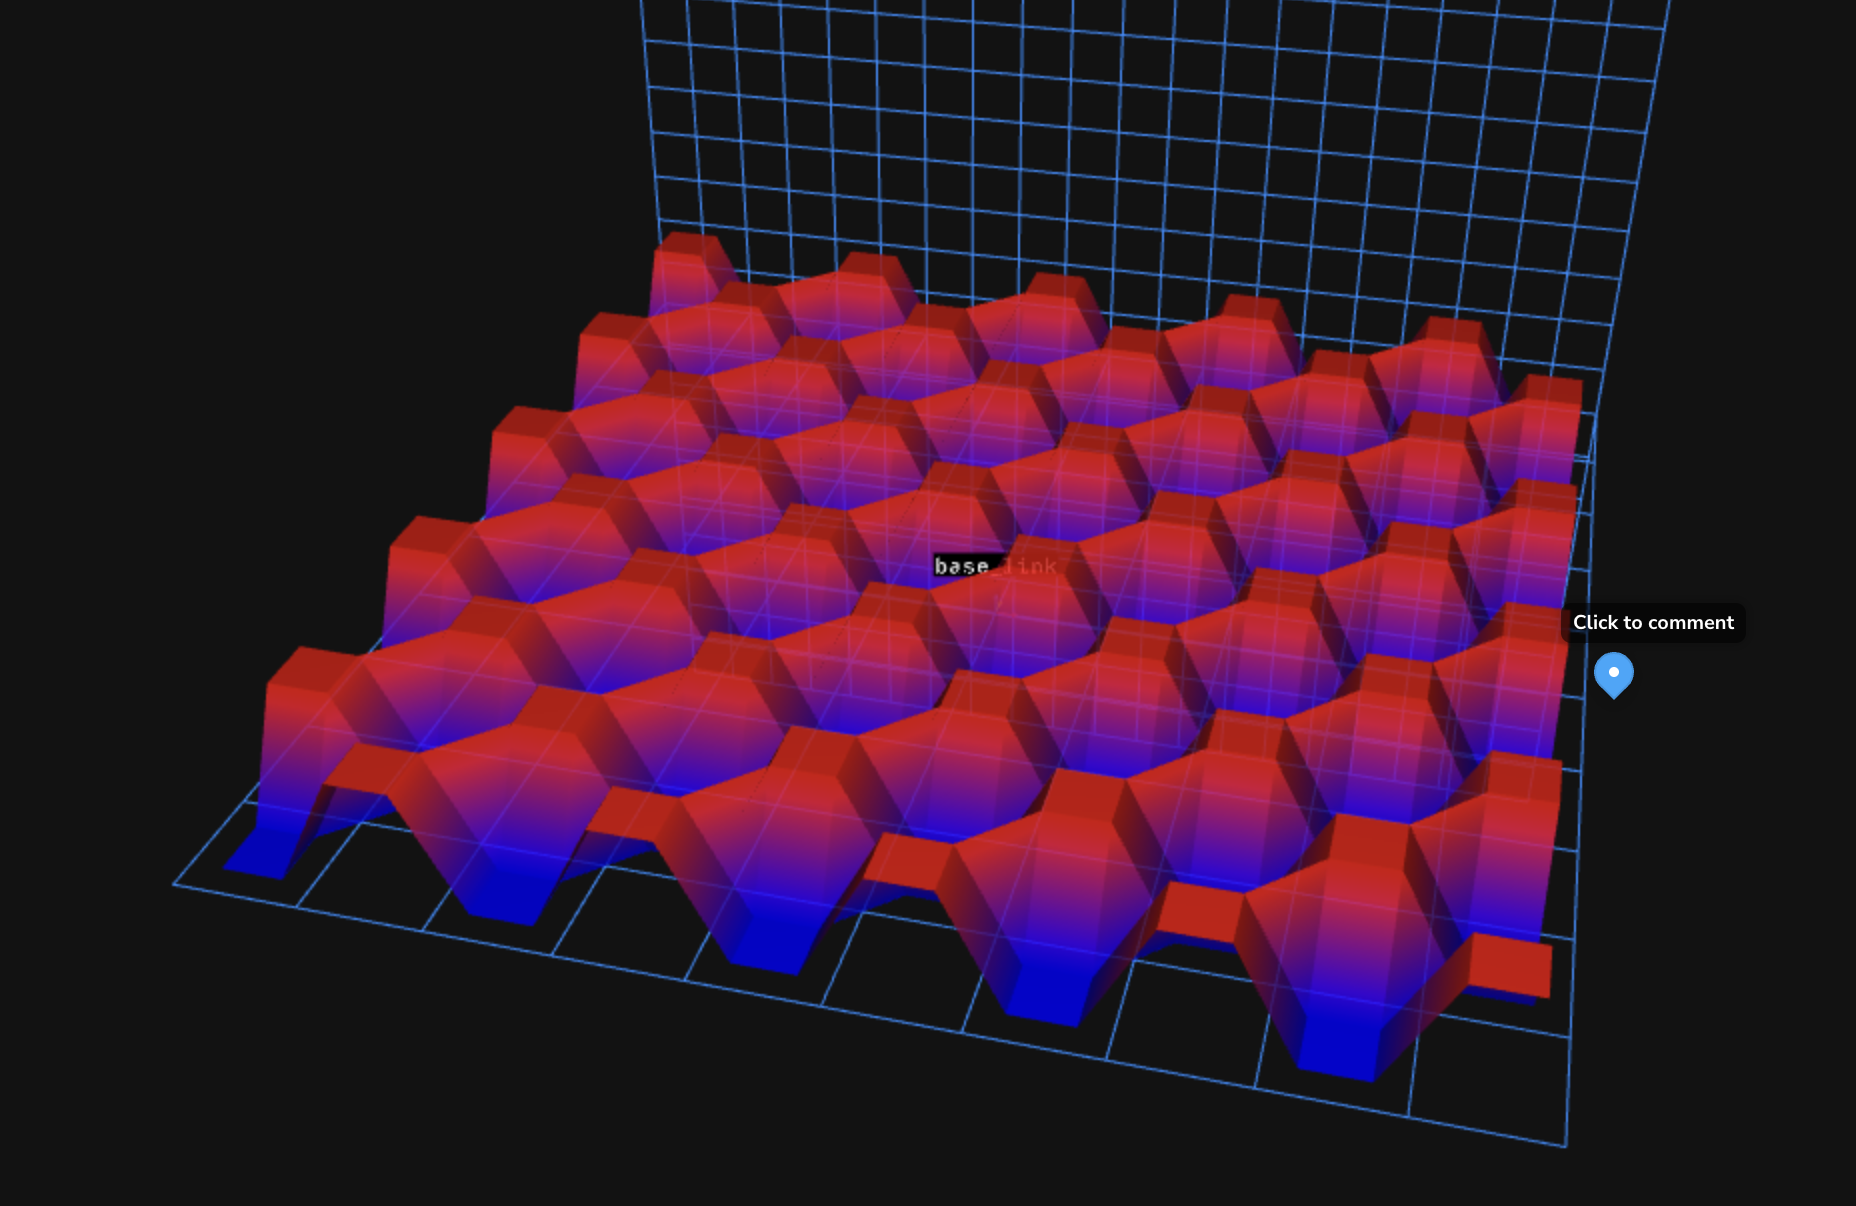
Have you ever wanted to get a 3D view of the entire world? One of our users did, but had some issues with z-fighting that kept the visualization within Foxglove from looking as sharp as it should. We think that outer-space fighting should be limited to intergalactic battles, so we added a new setting to enable a logarithmic depth buffer, which can improve rendering precision for large distance scales.
Using this feature may lead to a loss in rendering performance, but may be worth the price for users looking to visualize Earth-scale data, large maps, or just wanting to zoom in/out really, really far.
In this example below:
The Service Call panel now has an option to hide the request and response text fields. This allows you to configure a request once up front, then invoke the service call without any distractions. We love distractions, but only the kinds that have wet noses and wagging tails.
prefixItems
).type Output = {
field1: Message<"std_msgs/String">;
field2: Array<number>;
};
It is now possible to create elaborate return types, for example:
import { Input, Message, Time } from "./types";
import { subtractTimes } from "./time";
type InputType = Message<"geometry_msgs/PoseStamped">;
type Output = {
header: InputType["header"];
time_diff: Time;
translation: Message<"geometry_msgs/Vector3">;
random_array: Array<number>;
};
export const inputs = ["/pose_stamped"];
export const output = "/pose_difference";
let lastMessage: InputType | undefined;
// Calculates translation & time difference between two subsequent poses.
export default function script(event: Input<"/pose_stamped">): Output | undefined {
const message = event.message;
if (!lastMessage) {
lastMessage = message;
return undefined;
}
const output: Output = {
header: message.header,
time_diff: subtractTimes(message.header.stamp, lastMessage.header.stamp),
translation: {
x: message.pose.position.x - lastMessage.pose.position.x,
y: message.pose.position.y - lastMessage.pose.position.y,
z: message.pose.position.z - lastMessage.pose.position.z,
},
random_array: [Math.random(), Math.random()],
};
lastMessage = message;
return output;
}
For more information, see our Foxglove 2.0 Announcement.
You can now visualize your data and manage your Devices, Recordings, and Events all in the same app. This new workflow is available both in the desktop app and at https://app.foxglove.dev/. Click the Foxglove logo to access the new navigation from the visualization screen:
When opening the app, you will now be greeted with the Dashboard. The “Open local file”, “Open connection”, “Recently viewed”, and “Explore sample data” features are now part of the Dashboard.
The panel actions overlay now has separate buttons to split right and split down, rather than a single split button that chooses a split direction automatically. Hold the backtick (`
) key and hover over a panel to access the quick actions:
package://
URLs over a WebSocket connection.The Plot panel now displays more information about series errors and warnings in the legend.
Fixed some visual alignment issues in Plot and State Transitions.
toSchemaName
that matches one of the panel’s supported schemas.allFrames
when they should not have been.Performance Improvements
Bug Fixes
Other
UX Improvements
Performance Improvements
Bug Fixes