Foxglove 2.48.0
🤖 URDF Joint State Control
URDF robot models in the 3D panel can now be driven directly by sensor_msgs/JointState or foxglove.JointStates messages, performing forward kinematics within Foxglove. Previously, URDF visualization required publishing tf transforms, which often meant running complex forward kinematics calculations outside the app. See an interactive version in this playground.
🗂️ Sessions
Sessions let you group recordings from a single device into logical units — a drive, a mission, a field test — so you can organize and visualize data by context rather than by file boundaries. Define custom properties (location, stack version, mission type) to filter and search across sessions, and open a session to load all its recordings as one continuous dataset. See docs, currently available on Team and Enterprise.
🔌 Remote Data Loaders
Remote Data Loaders connect Foxglove to any queryable data source — internal databases, custom storage systems, or proprietary data lakes — by building a lightweight backend that produces MCAP on demand. The Remote Data Loader handles caching, seeking, and streaming so your team can visualize data directly from where it already lives, without exporting or re-uploading.
⌨️ Embedded Viewer Keybinding API
The embedded viewer now supports keyboard shortcut customization. Teams embedding Foxglove into review tools or operator dashboards can override or suppress built-in shortcuts that conflict with the host application, and register custom keybindings that notify the parent — enabling keyboard-driven workflows like assigning quality ratings, navigating recording playlists, or controlling playback without leaving the embedded viewer.
🔍 AI-Powered Docs Search
The documentation site now features AI-powered search. Ask a question in natural language and get a synthesized answer drawn from the docs, alongside traditional keyword results.
New & Improved
- Scene entities in the Image panel now synchronize with video frames when "Sync annotations" is enabled, preventing entities from rendering ahead of the displayed image
- Added "Install local extension…" command to the command palette for quickly installing
.foxefiles - Added a type filter to the "Recently viewed" dashboard list, allowing filtering by files, connections, or recordings
- Clicking a recent data source on the dashboard now loads the layout that was last used with that data source
- Removed expand/collapse buttons for table rows that contain only primitive values
- Clarified websocket frame-buffer overflow messaging so users can tell when drops happened while the tab was inactive
- Added support for the "equidistant" distortion model as an alias for "kannala_brandt" in ROS camera schemas
- Display a helpful warning when data imports stall at a self-hosted organization
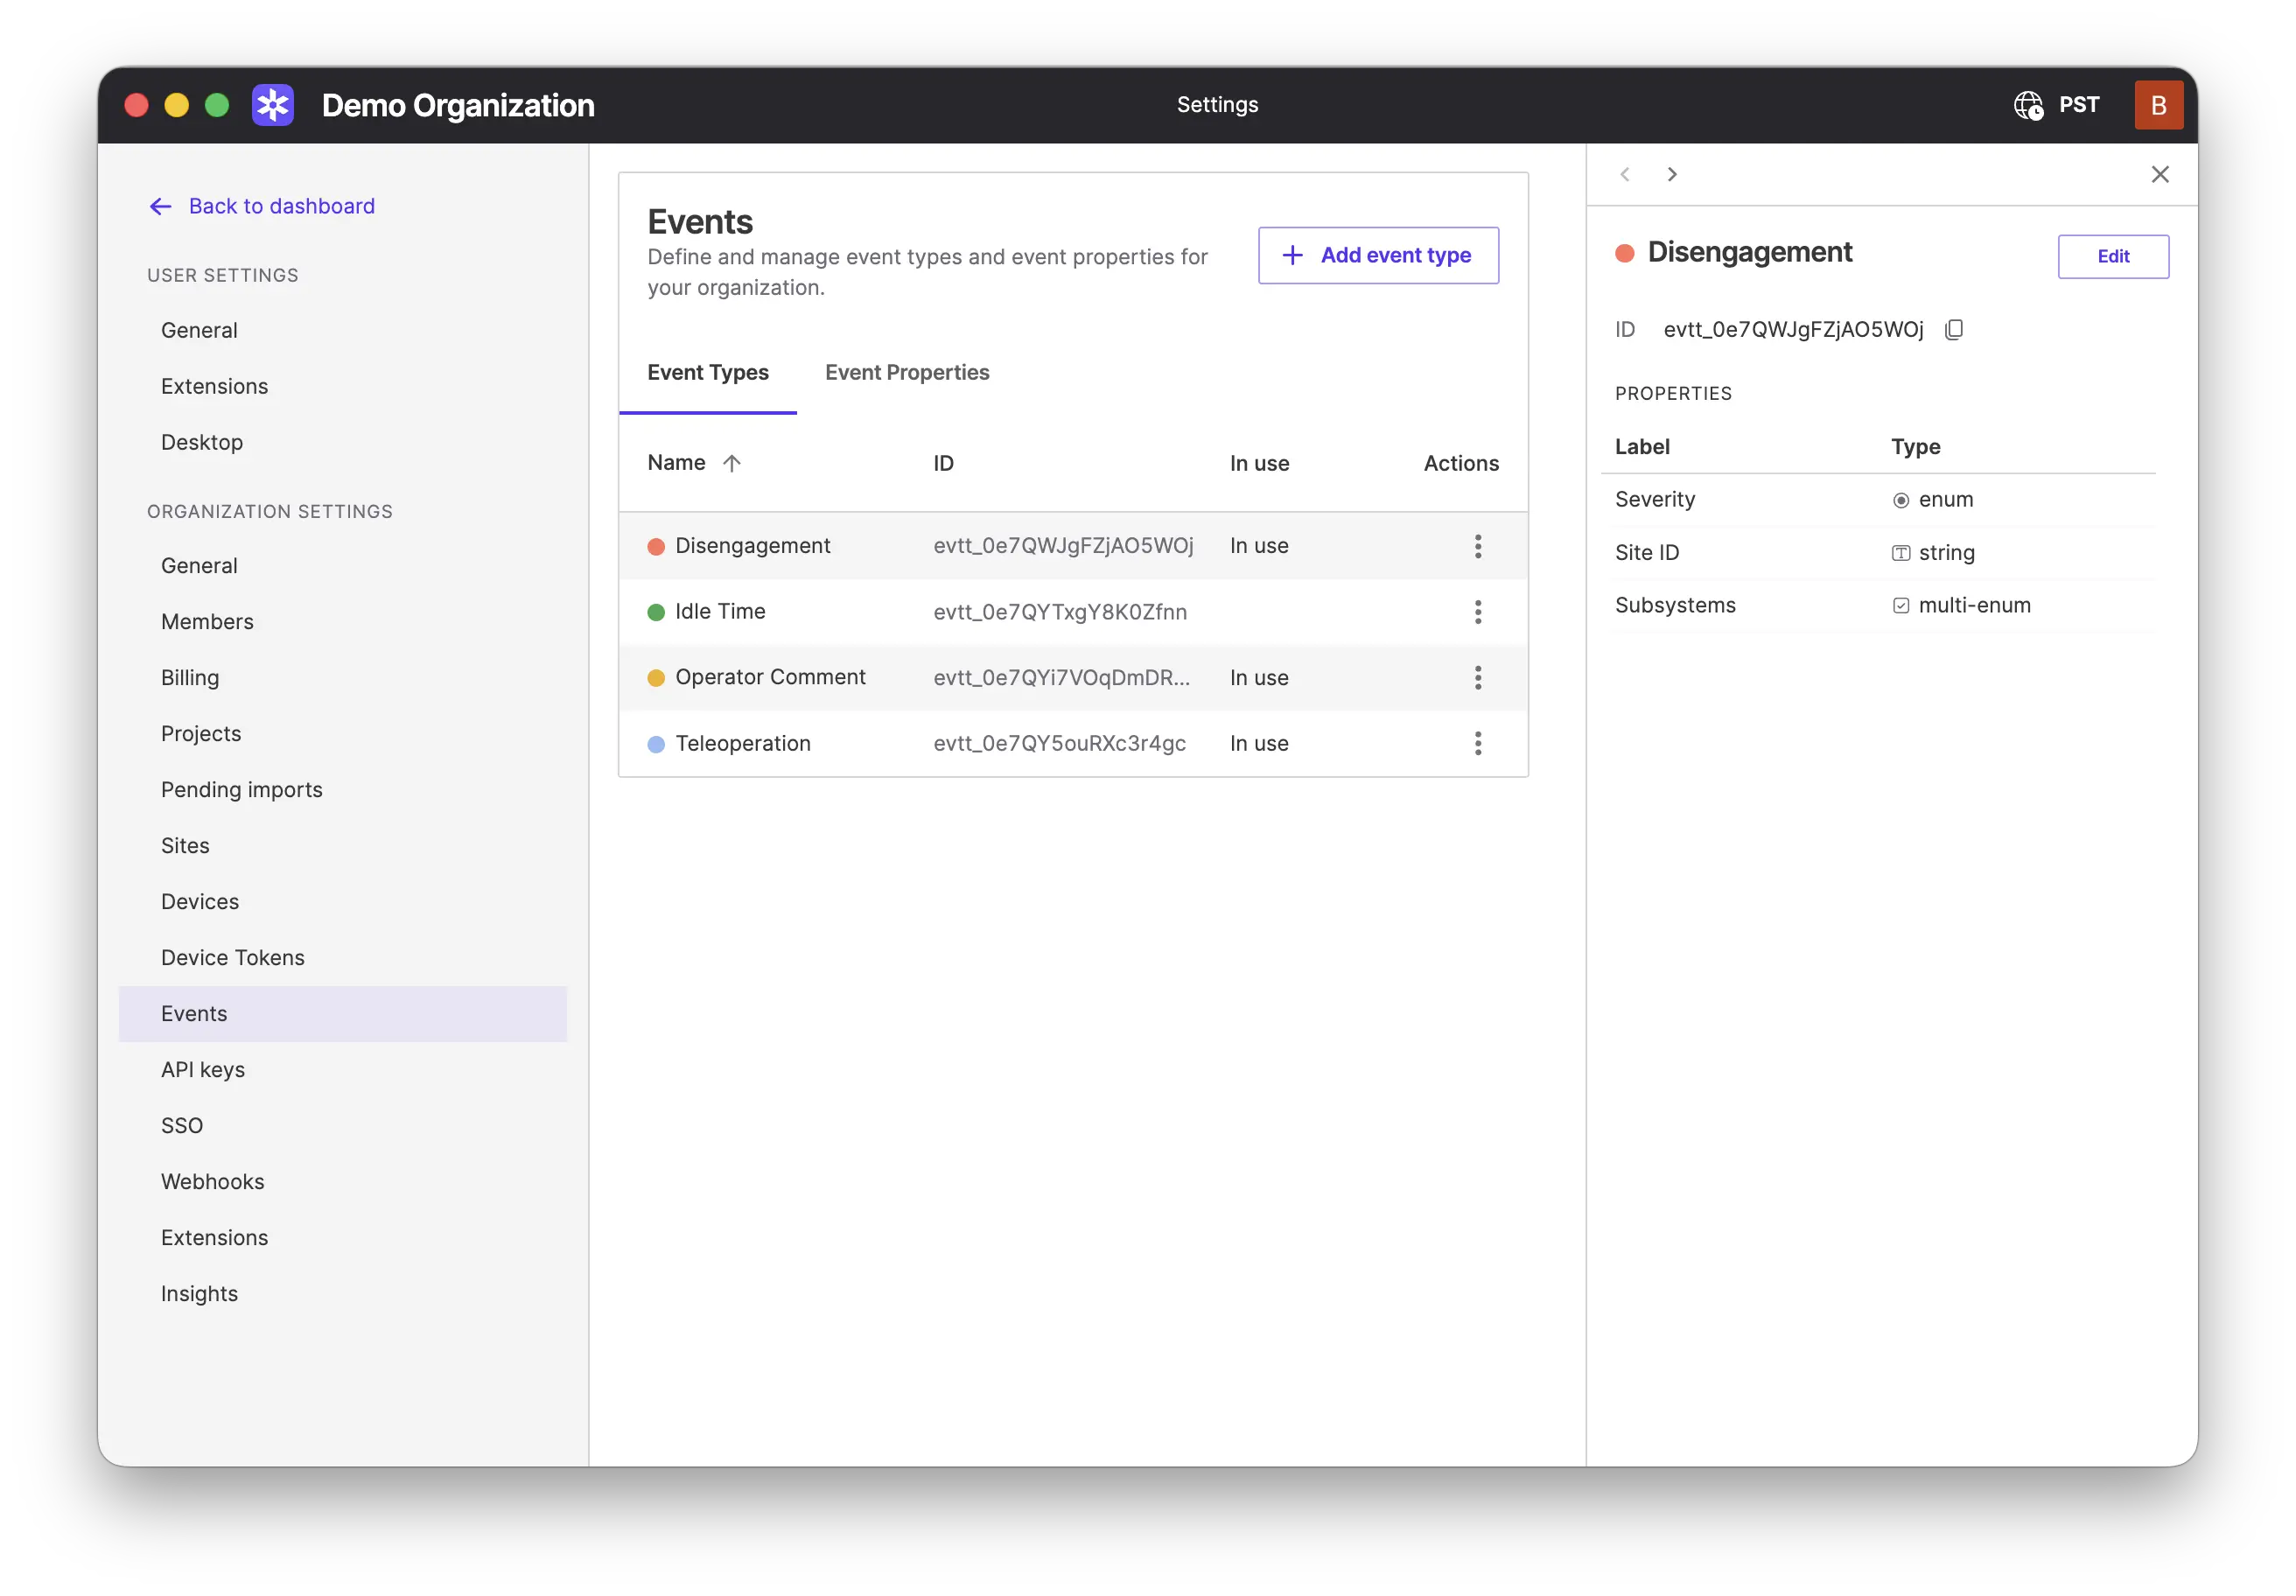
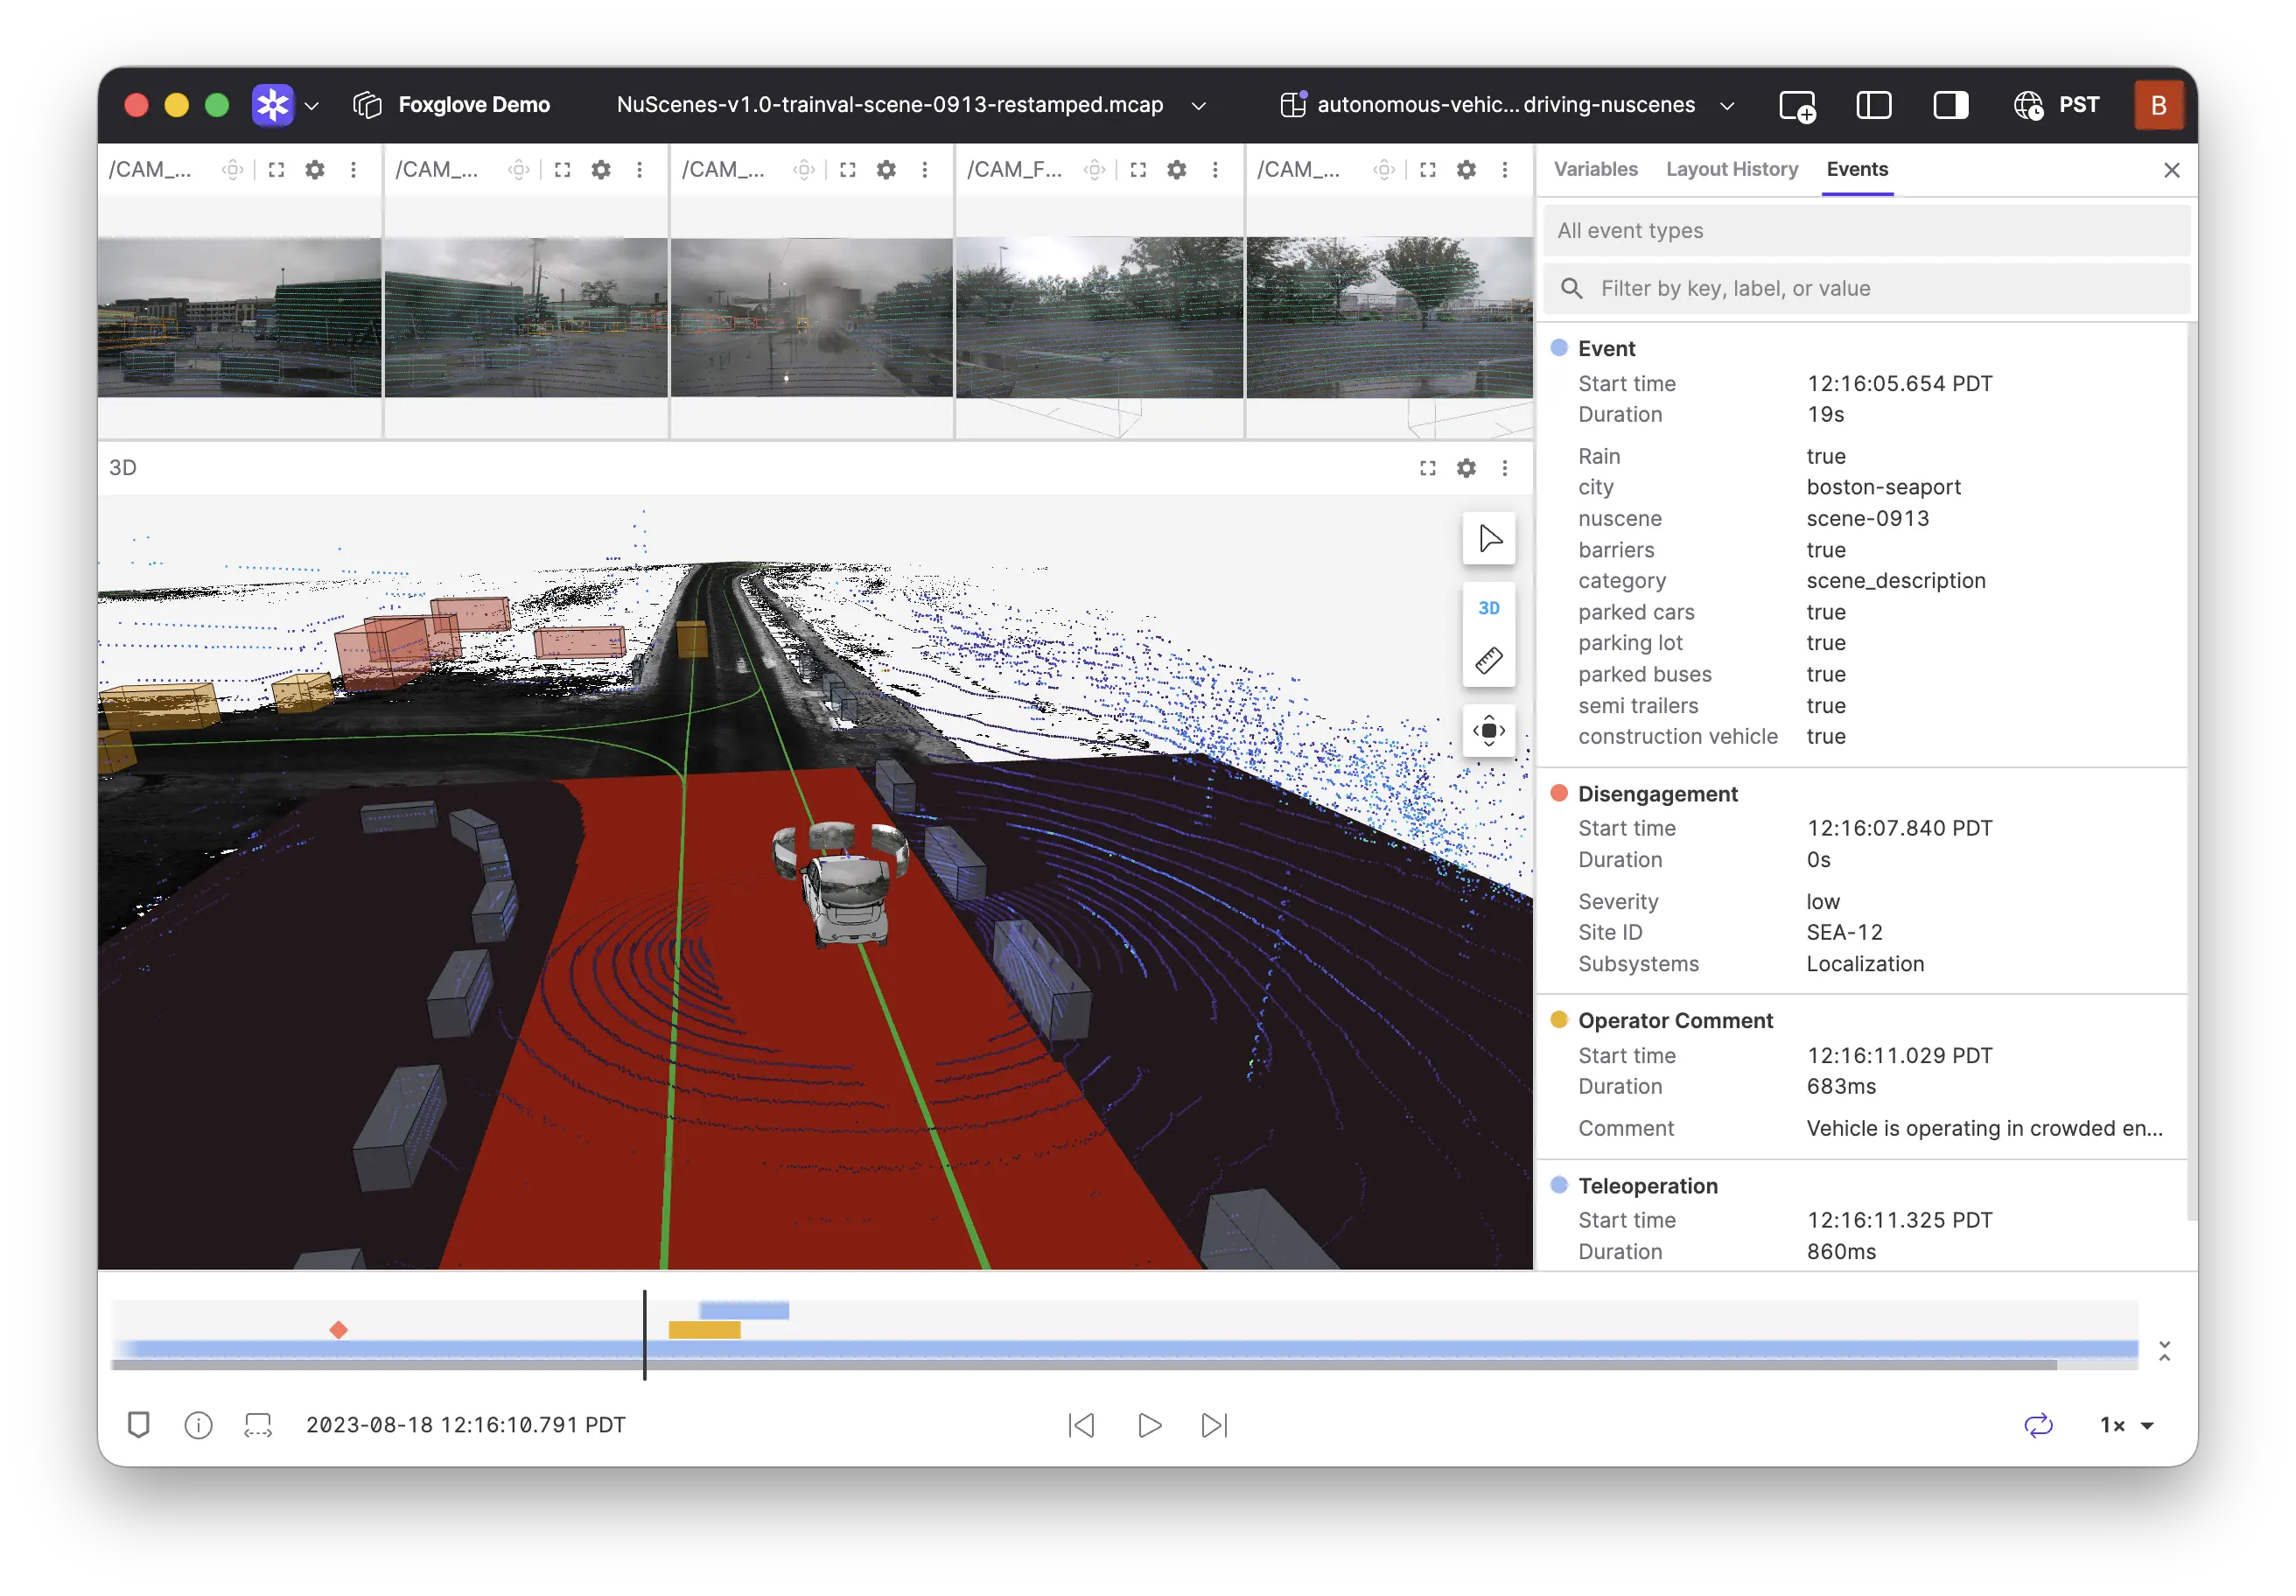
- Event time range editing has been standardized across Data pages and Viz. All editors now use consistent "Start time", "End time", and "Duration" fields with linked editing, replacing the previous mix of "Timestamp" and "Duration" vs. "Start time" and "End time".
- Reordered main sidebar navigation to prioritize Timeline
Performance
- Improved performance of image topics in 3D and Image panels
- General performance improvements
API
v1/data/streamnow accepts aprojectIdparameter to disambiguate devices with the same name in different projects
Fixes
- Fixed 'Access blocked' error when loading OpenStreetMap street tiles in the desktop app
- Fixed Image panel annotation metadata to support per-annotation values, which now correctly take precedence over top-level image annotation metadata
- Fixed occasional "No coordinate frames found" error when seeking backwards
- Raw Messages panel now shows an explicit error when a message path uses Plot-only time-series functions such as
@delta,@derivative, or@timedelta - Fixed the Table panel showing a misleading "Cannot render primitive values" error when the message path points to a nonexistent field
- Fixed time zone handling on the Timeline page
- Fixed recordings with forward slashes in the
recordingKeyURL parameter failing to load - Fixed a crash in the Plot panel when data arrived before the chart canvas finished mounting
- Fixed signing out from an embedded viewer not clearing partitioned cookies, preventing login loops
- Fixed the forward arrow in the Timeline date picker appearing clickable when the time range cannot advance further
- Fixed a Plot panel error when switching from "Custom field" timestamp to "Message path" x-axis
- Fixed download options incorrectly appearing for the Remote Data Loader source
- Fixed sync annotation error not clearing when turning off annotation visibility in the Image panel
- Fixed fullscreen panel expansion not filling the workspace when the panel is inside a Tab panel
- Fixed Plot panel message path function chaining so scalar functions work after
@derivative,@delta, and@timedelta - Fixed the Gauge and Indicator panels incorrectly showing valid message path function suffixes as invalid
- Fixed a crash when a topic converter returned an array containing null elements
- Fixed unattached buffer error on video data from a User Script
- Fixed copied topic names pasting in incorrect order when more than 9 topics were selected in the sidebar
- Fixed cursor jumping to the end of message path fields when editing array indices or path segments
- Fixed the Log panel constantly scrolling when a large number of log messages were present
Downloads: Linux: deb amd64 arm64, snap amd64 | Windows: x64 arm64 | Mac: Apple Silicon Intel