Foxglove 2.25.0
📮 Plot by any timestamp
You can now generate plots and state transitions using arbitrary timestamp fields from your messages. This gives you more flexibility in how you visualize your time-series data.
👨💼Layout Manager
We've introduced a dedicated page for managing your Foxglove layouts. The new layout manager makes it easier to organize, share, and maintain your visualization configurations.
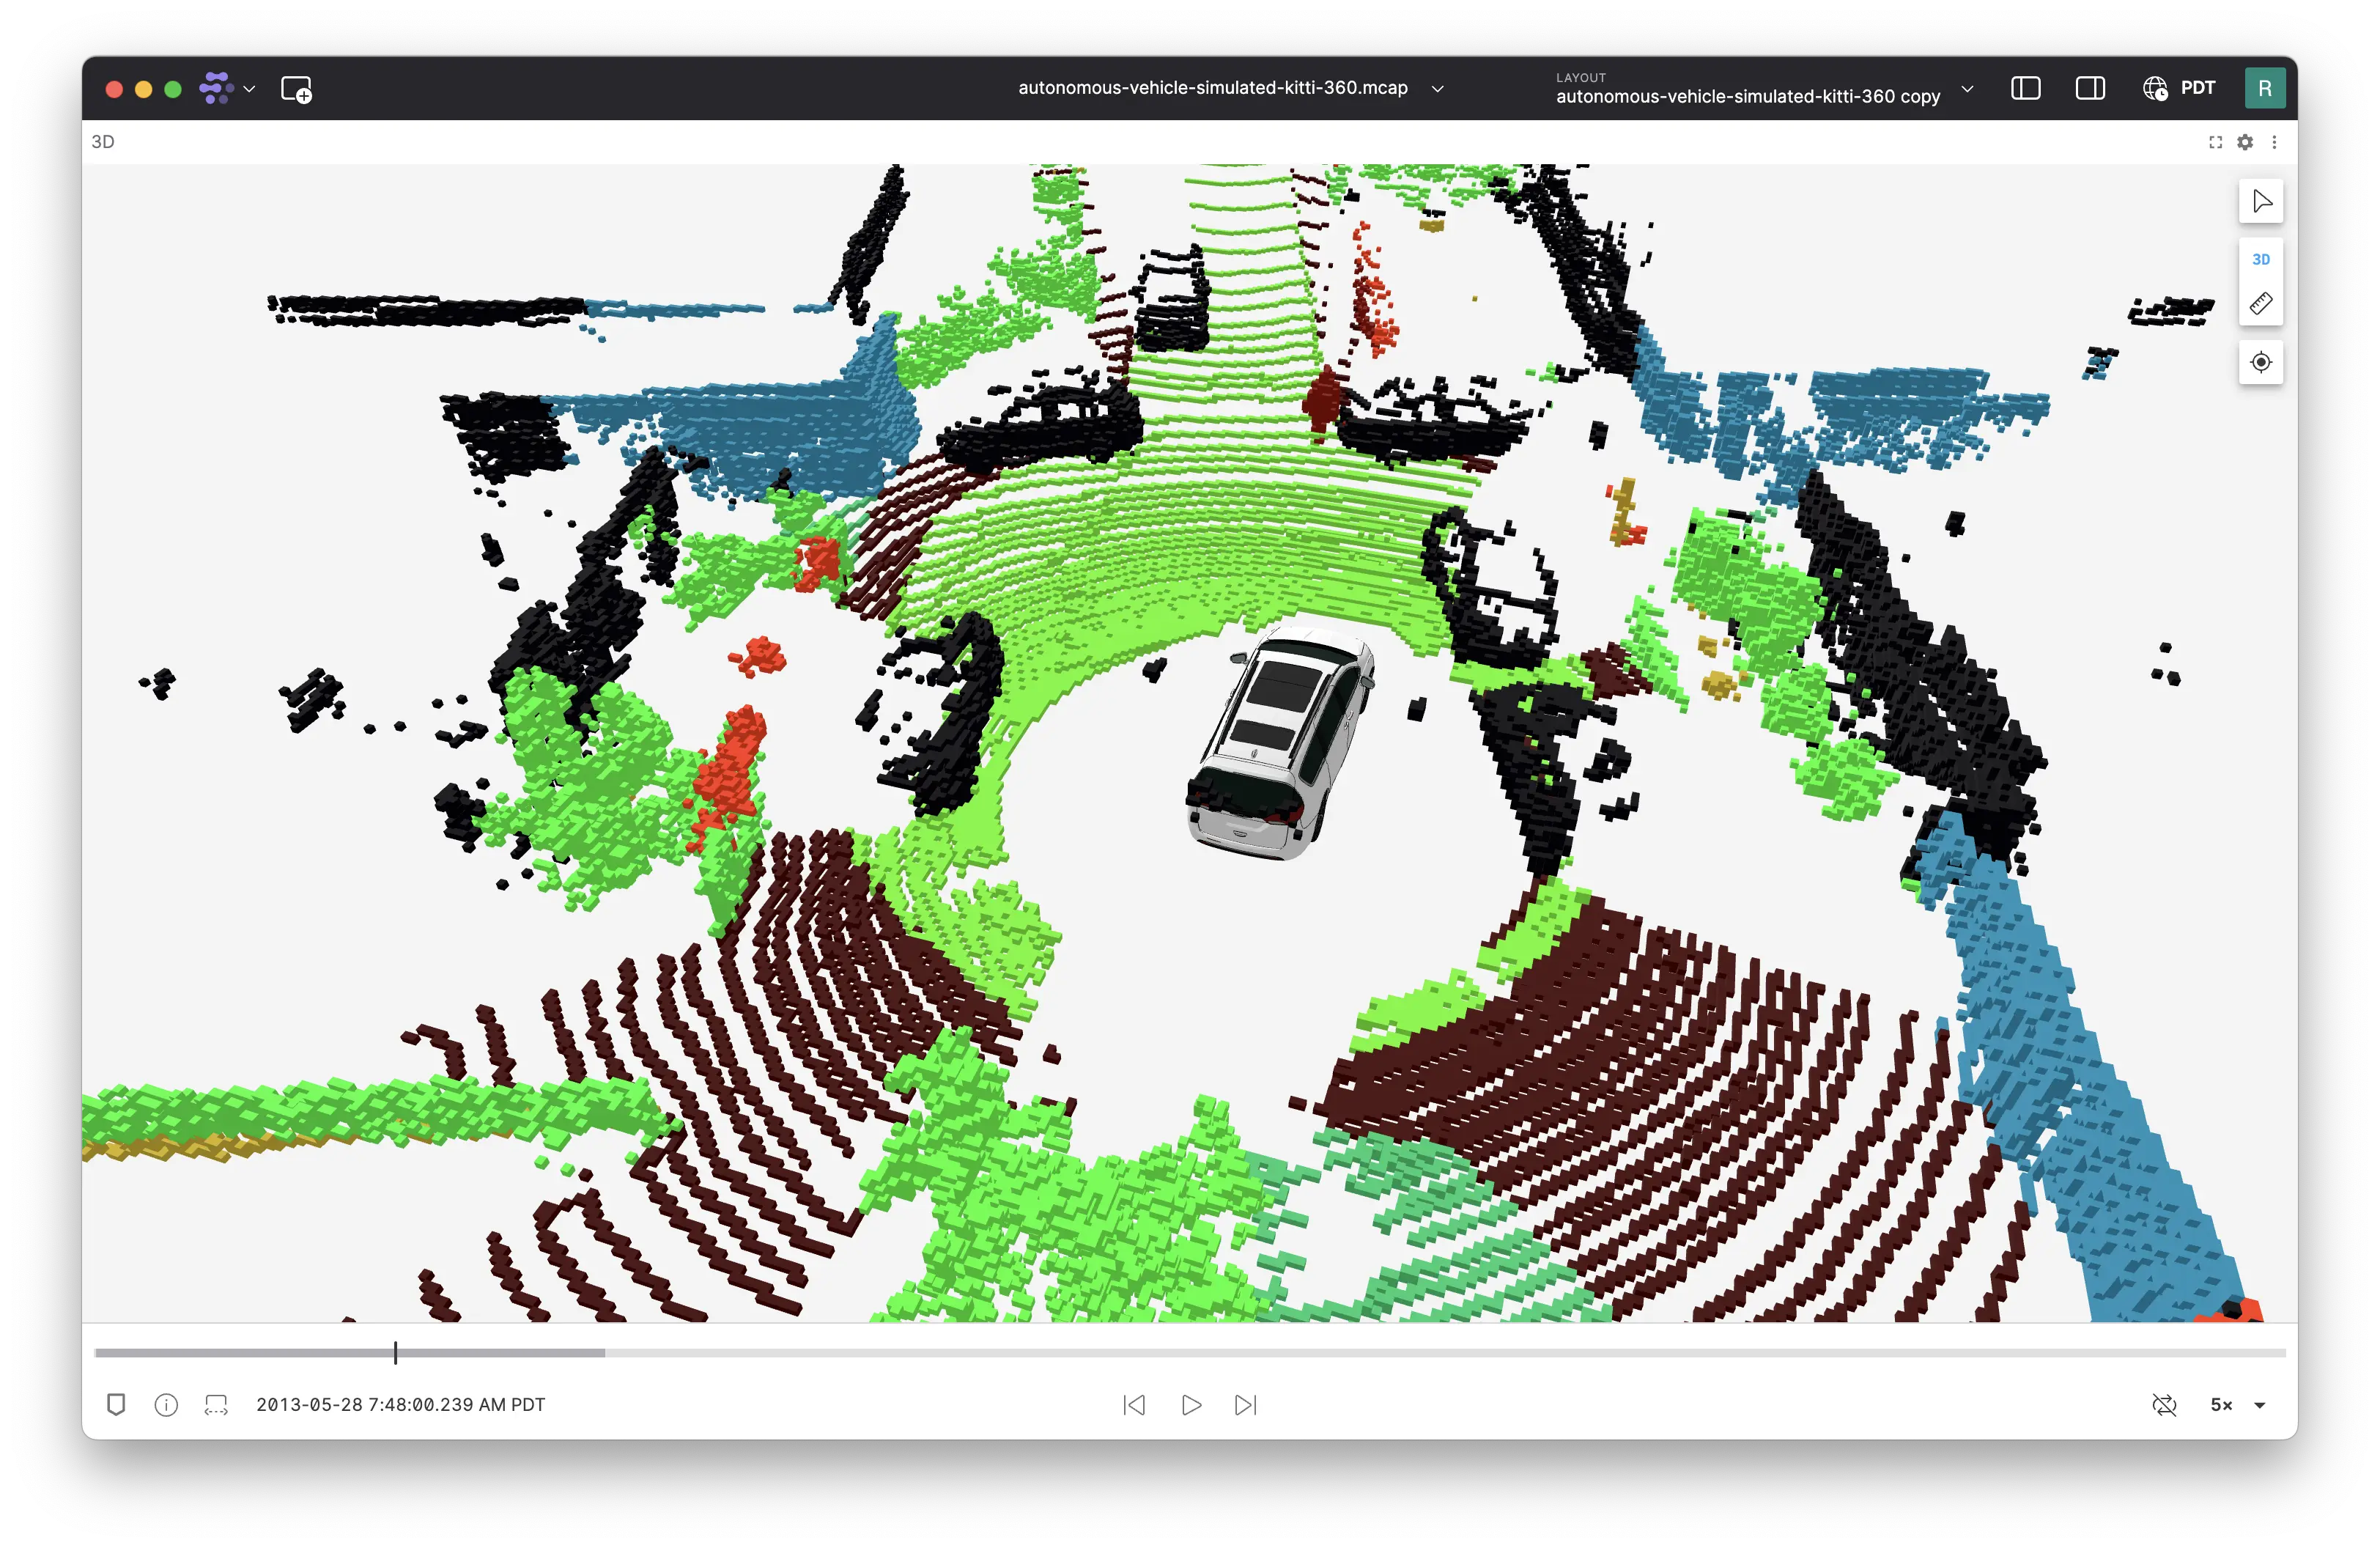
🧊 Point cloud cube mode
Point clouds and laser scans now support a cube rendering mode that displays points as cubes. This is useful when your point cloud data semantically represents voxels.
New & Improved
- Replaced the floating reset view button with a panel toolbar button in the Plot and State Transitions panels
- Device tokens are now automatically disabled when their associated device is deleted
Performance
- Improved performance when streaming data in the web app
- Enhanced performance for timeseries plots
- General performance optimizations across the application
Fixes
- Fixed an issue in the Plot panel where index plots could not be zoomed independently on the x-axis or y-axis
- Fixed a bug where zooming-in on XY plots would not show data points indicating data is no longer down sampled
- Fixed an issue where the 3D panel would not properly render frame transforms after changing the session ID
- Fixed bulk actions in the recordings list to properly scope to the selected device
- Fixed an issue where the settings panel would not open when clicking the settings icon in the object inspector
- Fixed incorrect positioning of 3D panel crosshairs in certain scenarios
- Fixed a bug where recordings from deleted devices remained visible
- Fixed line clipping in the 3D panel when using small near clipping plane distances
- Fixed an issue where GeoJSON shape selection outlines would persist after moving the mouse away
Downloads: Linux: deb amd64 arm64, snap amd64 | Windows: Universal | Mac: Universal