Foxglove Visualization
Download Foxglove as a desktop app (available on Linux, Windows, or macOS), or navigate to the web app in a Chrome browser window.
Extensions
- Installing extensions via the registry
Other
- Creating shareable links prefixed with
foxglove://
Interface
Connect to a data source to explore it with Foxglove's visualization and debugging tools.
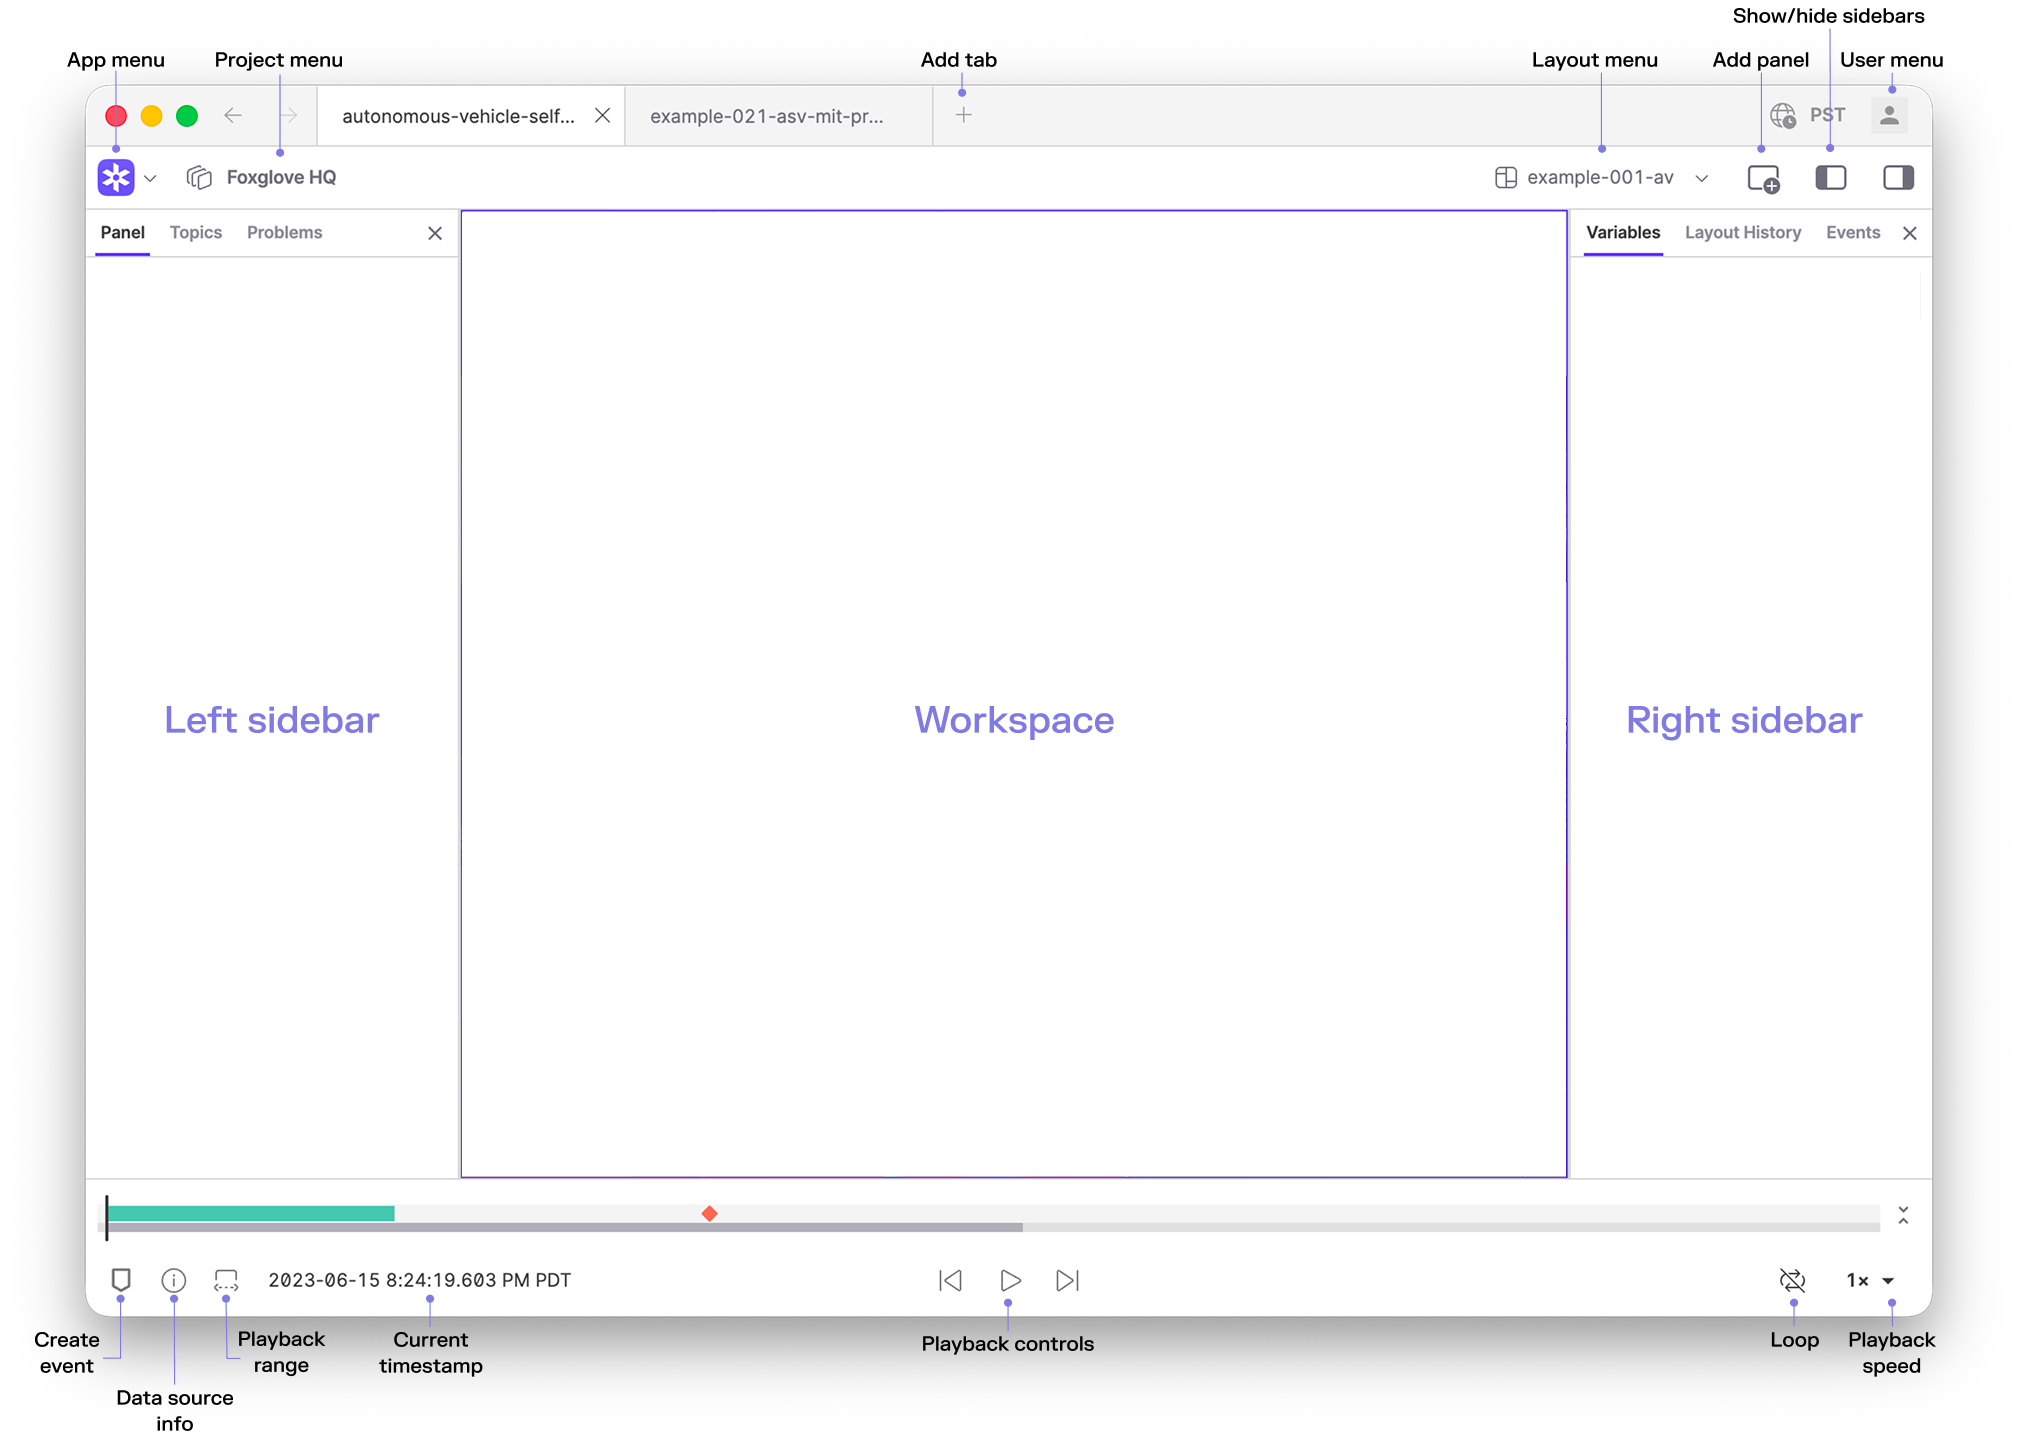
| component | description |
|---|---|
| App menu | Connect to a data source, toggle the sidebars, or view resources |
| Add tab | Add a tab to the current window |
| Add panel | Add a panel to the current layout |
| Layout menu | Save your workspace view as a layout and share it with teammates |
| Left sidebar | Edit panel settings (Panel), view data source's topics (Topics), and troubleshoot issues with your connection (Problems) |
| Right sidebar | Set layout-wide variables (Variables), write layout-scoped user scripts (User Scripts), and view playback metrics (Performance). Must enable debugging features in the General settings to see the Performance tab |
| User menu | Sign in to your Foxglove account, configure preferences, manage extensions, and more |
Sidebars
Panel
Edit panel settings for any selected panel.
Topics
View all topics available in the data source, along with their data types, message encodings, and message rates. Use the filter field to search by topic or schema name. Wrap a term in double quotes (for example "prpl") to match that exact text instead of a fuzzy subsequence.
Message frequency and count are not available for data streamed from Foxglove Data Platform.
Problems
See a list of playback errors to troubleshoot.
Variables
Set layout-wide variables that can be used in different panels with FoxQL.
User Scripts
Write layout-scoped data transformations in User Scripts. Open the User Scripts tab in the right sidebar or use the command palette to create and switch scripts.
Performance
Display playback and data-streaming performance statistics.
The following statistics are displayed for a given playback session. "Instantaneous" statistics are reported based on the most recent frame, and also are averaged over the last 5 seconds.
Memory usage
Details the jsHeapSizeLimit, usedJSHeapSize, and totalJSHeapSize.
Main thread
Frame rate
The number of frames played per second. Though the player can play back at up to 60fps, this statistic will be lower if frames take longer than 16ms to render.
Latency
Measures time for information to travel from the data source to the visualization panels.
User scripts
Measures time spent executing user scripts, both individually and in total.
Data pipeline
Playback speed
The player tries to play at the speed specified by the user, but may not be able to keep up, given heavy layouts and large amounts of data. This chart displays the actual playback speed as a ratio of bag time to playback time.
Frame rate
The number of frames played per second. Though the player can play back at up to 60fps, this statistic will be lower if frames take longer than 16ms to render.
Bag frame time
The duration in bag-time for the rendered frames in milliseconds. To "keep up" with playback, Foxglove will often emit "larger" frames.
Data throughput
The amount of data received by the player in megabits per second. For remote bags, this includes topics that the player is not subscribed to. This statistic does not account for Content-Encoding compression, so it may be larger than the actual network bandwidth.
Desktop-only features
Some features are only available via the desktop app. Specifically:
- Tabs — Open multiple data sources in a single window using browser-style tabs. Create new tabs, drag to reorder, and use keyboard shortcuts to switch between them. Each tab maintains its own navigation history.
- Opening a native ROS 1 connection
- Loading local URDF and mesh resources in the 3D panel using URLs prefixed with
package:// - Exporting the current panel layout to a video file
System requirements
Foxglove visualization requires Chrome v130+ on Linux, Windows, or macOS. Make sure you are using the latest version of Chrome, or download Foxglove Desktop instead.
Graphics acceleration is strongly preferred when using the Image panel for video replay or the 3D panel. See checking video acceleration for more.
Actual performance will depend significantly on a number of factors including the data you are visualizing, network connectivity, and whether you're looking at live, local, or cloud data - among other factors. Use the performance sidebar to profile your workloads.