Building queries
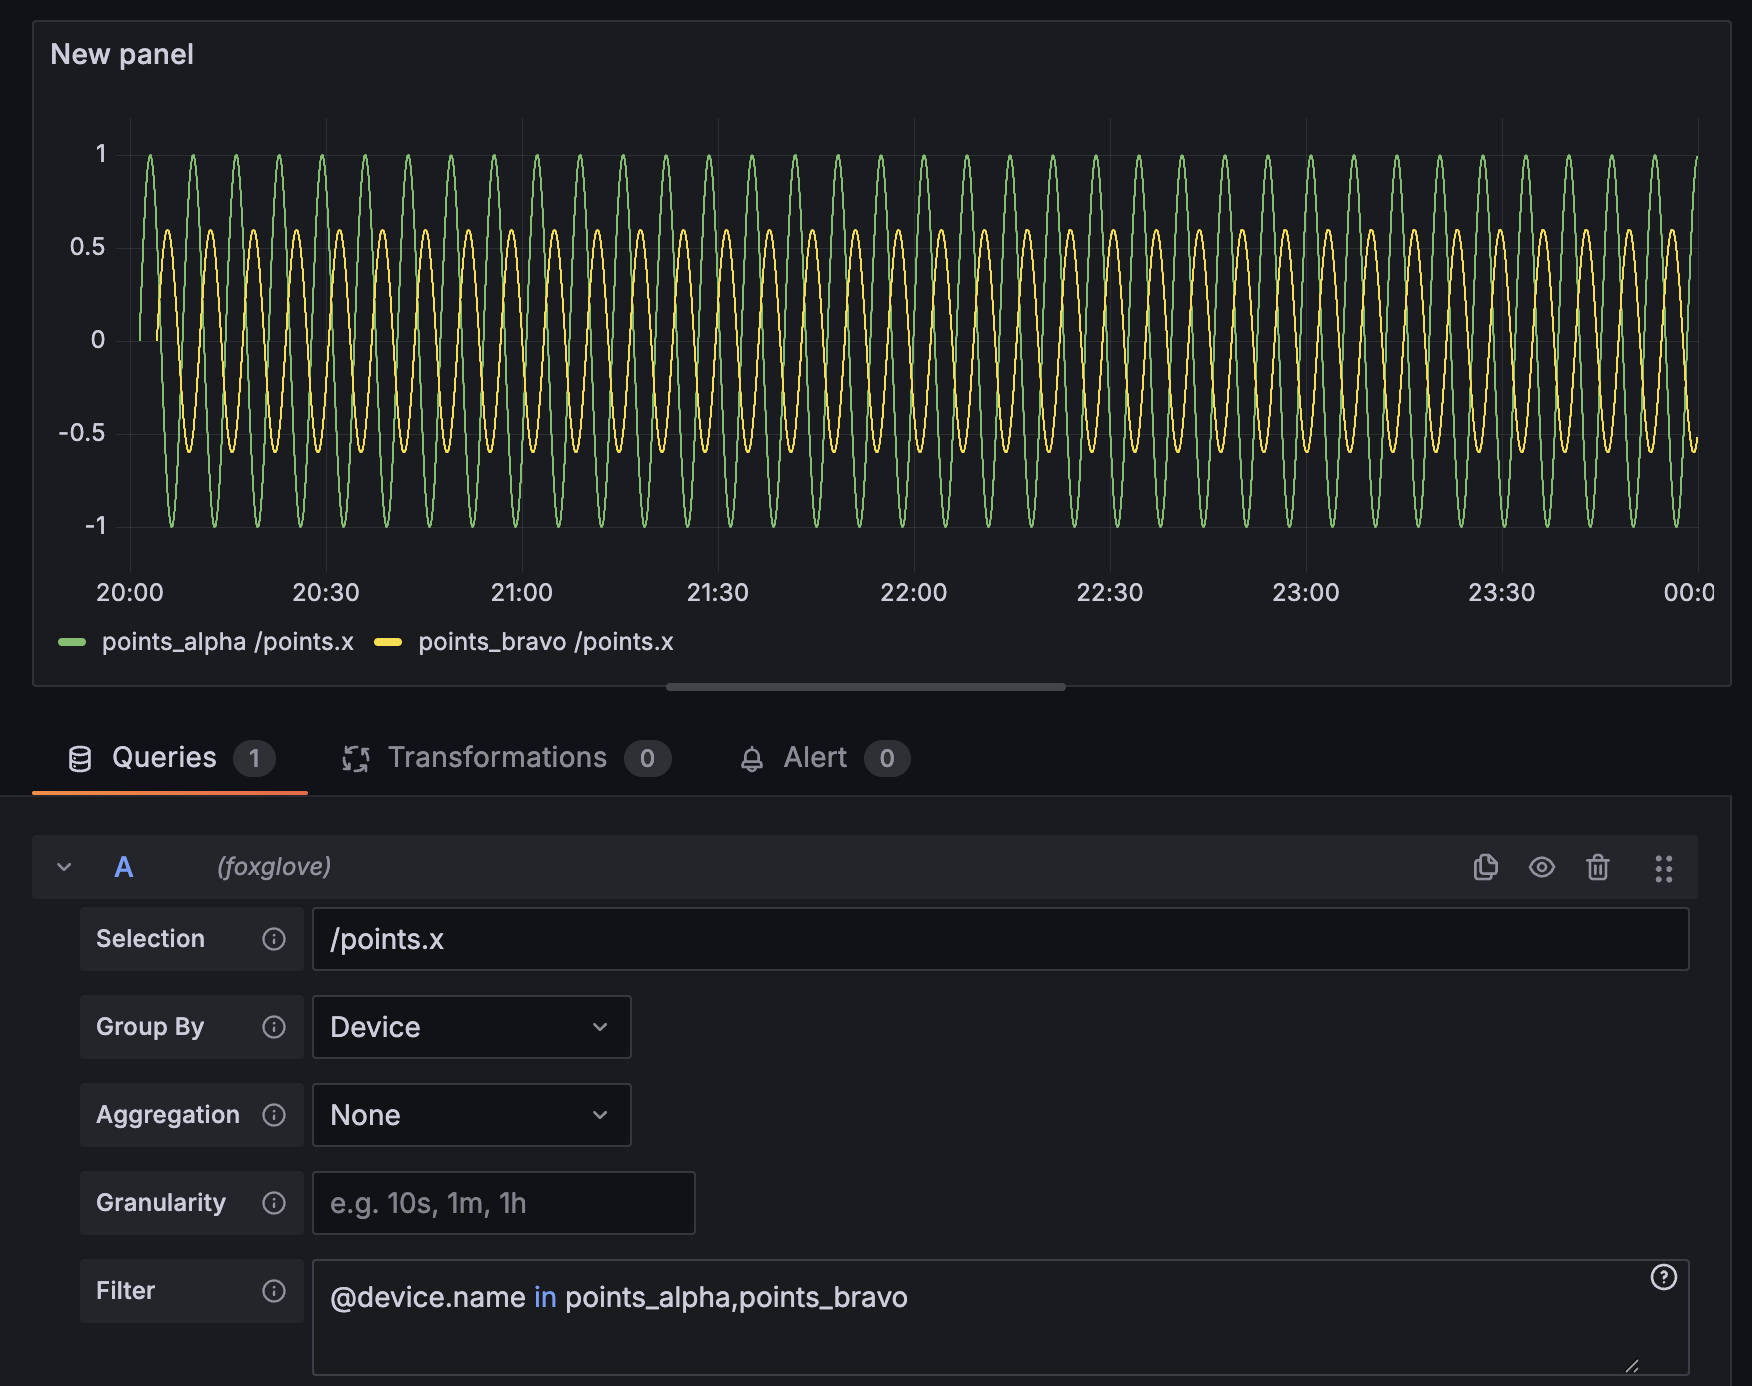
If you've used the Foxglove Search page, the filter field and granularity control will look familiar — they query the same engine. The filter text is the Search language. For Grafana queries, there are additional aggregation and grouping controls.
Selection
Selection is one text field. It retrieves values from Foxglove. Enter either a FoxQL expression or a device property.
FoxQL expression
A FoxQL path reads values out of your recordings. Write the topic exactly as it appears in the recording. A leading / is part of the topic name, so imu.x and /imu.x are different topics. Enter a FoxQL expression that resolves to a numeric field:
/imu.linear_acceleration.x
camera/front.exposure
/battery.cells[0].voltage
/diagnostics{name=="motor"}.temperature
The Grafana plugin supports numeric queries only. FoxQL expressions must end at a numeric leaf. FoxQL functions are not supported.
Device property
For a device property, enter @device.properties.<key>, such as @device.properties.version. The value must be a numeric custom property. Device property queries always group by device; the Group By control is hidden.
Group By
Group By controls how many series the panel draws. It applies to FoxQL selections only. A device property selection always groups by device.
- Device — one series per device. This is the default.
- Device Property — one series per distinct value of the custom property key you enter. Enter the bare key (
fleet). Use this to compare fleets, hardware revisions, or sites rather than individual robots.
Aggregation
Aggregation downsamples each series into fixed time bins.
| Method | Result per bin |
|---|---|
| Last | Most recent value |
| First | Earliest value |
| Max / Min | Largest / smallest value in the bin |
| Sum | Sum of values |
| Average | Mean of values |
| Median | Median of values |
| P50 / P90 / P95 | Percentile of values |
Leave Aggregation set to None to plot raw values. The Interval input appears only after you choose a method other than None.
Interval is the bin width for the values you're charting. Enter a duration such as 10s, 1m, or 1h. Leave it empty to use the dashboard time range divided by the panel's Max data points (under Query options) — roughly one bin per pixel. That default usually follows the time range as you zoom.
Granularity
Granularity sets the bin width for evaluating filter conditions, before they're applied to the selected series. Same idea as granularity on the Search page.
A filter of /accel.x > 5 with a granularity of 1m keeps selected values that fall in the same one-minute bin as a matching message.
Granularity uses the same duration format as Interval, and defaults to the dashboard time range divided by Max data points.
Granularity and Interval are different settings. Interval bins the values you're charting; Granularity bins the filter conditions that decide which values to keep.
Duration format
Interval and Granularity share the same duration format. Valid suffixes are ms, s, m, h, d, w, M, and y. A bare number is seconds — 30 means 30 seconds. Fractional values such as 1.5h are accepted. Compound durations such as 1h30m and spelled-out forms such as 5min or 1hr are rejected. The value must be greater than zero.
Filters
Filter narrows a query with the Search page filter language. Grafana also accepts in, which the Search page does not. Leave the field empty to apply no filter. Typing suggests the static field names (@device.name, @event.id, and the other built-in fields), then the operators that field accepts. The Filter syntax button lists the prefixes and examples, and inserts a prefix at the cursor. Ctrl + / (Windows and Linux) or Cmd + / (macOS) opens it too.
@device.name like husky
/diagnostics.level > 1
(@device.name == a OR @device.name == b) AND /imu.x > 1
The editor colors operators, and/or, and parentheses, and it reports a syntax error before the query runs. A filter that does not compile is not sent. See Operators for spacing and quoting.
| Prefix | Matches on |
|---|---|
@device. | Device ID, name, enabled, and custom properties. @device.name is the device's name, not its ID. @device.id is the ID. @device.properties.fleet is a custom property. |
@event. | Event ID, event type, device ID, and custom properties. @event.eventTypeId is the event type's ID, not its name. @event.id is the event's ID. |
@recording. | Recording ID, key, device, path, and metadata. @recording.path like %front-camera% matches recordings whose name contains front-camera. @recording.metadata.<record>.<key> matches a metadata entry, including the MCAP metadata record name. |
@episode. | Episode ID and metadata. @episode.id is the episode's ID. @episode.metadata.label is a metadata key. |
@session. | Session ID, key, device, and custom properties. @session.key == abc123 matches the session key. @session.properties.<key> is a custom property. |
/topic.field | A FoxQL path and the values decoded from it. Message filters can match strings and booleans as well as numbers. FoxQL filters ({…}) do not parse here. Write that condition separately, such as /diagnostics.status[:].hardware_id == motor. |
/topic exists | Recordings that contain the topic. A topic with no field only supports exists. This needs a Primary Site at version 0.0.102 or later. |
Selection and Filter take a device property with the full @device.properties. prefix, such as @device.properties.fleet. Group By takes the bare key (fleet).
visual("…") is not supported in Filter. A similarity search does not produce a numeric series.
Operators
Write equality as ==. A single = is a syntax error. A space must separate an operator from its operands: @device.name == husky runs, and @device.name==husky does not. Quote a value that contains a space or any of (, ), ", =, <, >, !, \.
| Operator | Meaning |
|---|---|
== != | Equal to, not equal to |
> >= < <= | Numeric comparison |
like | Pattern match on a string field. Same operator and pattern syntax as like on the Search page |
contains not-contains | A multi-select custom property includes (or does not include) the value |
exists | The field or topic is present. Takes no value. |
in | Matches any value in a comma-separated list written as one token, such as @device.name in a,b. A space after a comma (a, b) is a syntax error. |
Invalid filters
An empty field means no filter. Text that does not compile stays in the editor, is marked invalid, and is not sent — the query fails with that message instead of running without the filter.
A filter that contains a $ template variable is not checked as you type. Grafana substitutes the variable when the query runs, and a bad expanded filter fails then.
Example queries
Adapt the paths, property keys, and device names to your fleet.
Chart a numeric topic across the fleet
| Control | Value |
|---|---|
| Selection | /battery.percentage |
| Group By | Device |
| Aggregation | Average, Interval 1m |
| Filter | (none) |
One series per device, averaged into one-minute bins. Leave Interval empty if you want the bin size to follow the dashboard zoom level.
Limit the chart to named devices
Keep the selection above and set Filter to:
@device.name in robot-a,robot-b,robot-c
Or drive the list from a Grafana dashboard variable — see Dashboard variables.
Compare fleets instead of individual robots
| Control | Value |
|---|---|
| Selection | /battery.percentage |
| Group By | Device Property → fleet |
| Aggregation | Average, Interval 5m |
One series per distinct fleet property value. Devices must carry a fleet custom property.
Chart only while a condition holds
| Control | Value |
|---|---|
| Selection | /imu.linear_acceleration.x |
| Group By | Device |
| Aggregation | Max, Interval 10s |
| Granularity | 10s |
| Filter | /battery.percentage < 20 |
Charts peak acceleration only while the battery is below 20%. Matching Granularity and Interval keeps filter evaluation and chart bins on the same width.
Chart a device property over time
| Control | Value |
|---|---|
| Selection | @device.properties.version |
| Filter | @device.properties.fleet == warehouse |
Plots the numeric version custom property for devices in the warehouse fleet. Group By is fixed to Device for property selections.
Dashboard variables
Grafana template variables work in every text input of the query editor: the selection, property keys, filter text, interval, and granularity.
The editor does not check text that contains $. Grafana substitutes the variable when the query runs. If the expanded text does not compile, the query fails.
The plugin can't populate variable options from Foxglove. Build device, topic, and field lists as custom, constant, or textbox variables.
Match several devices with in
in takes one comma-separated token, with no spaces: @device.id in dev_a,dev_b.
A multi-value variable does not expand to that token by itself. $ids and ${ids} use Grafana's default format, which wraps the values in braces ({dev_a,dev_b}). That string is not a valid in list. Use the csv format:
@device.id in ${ids:csv}
With ids set to dev_a and dev_b, the filter runs as @device.id in dev_a,dev_b. The same form works for names: @device.name in ${names:csv}.
A variable with one selected value can be $ids or ${ids}. csv stays valid when more than one value is selected, so use it for any multi-value device list.
Fill in a FoxQL path
A single value can stand in for part of a path, or for the whole path:
/imu.${axis}
${topic}.x
If axis is x, the selection compiles as /imu.x.
A multi-value variable is still one string after substitution. Selection is one FoxQL expression, not a list of them. /imu.${axis:csv} becomes /imu.x,y, which does not compile, so the query fails instead of plotting both fields. To limit which devices are drawn, keep the path as one expression and put the list in a filter, as in @device.id in ${ids:csv}.
Limitations
- Series values must be numeric. String and boolean fields can be used in filters, but not plotted.
- FoxQL functions such as
.@rpyand.@degreesare not supported in the selection or in a message filter. visual("…")is not supported in Filter.- Queries run against a single Primary Site, set on the data source. To chart data from more than one site, add a data source per site.
- The plugin doesn't provide Grafana annotations or variable queries.